Age-Adjusted Rates - Statistics Teaching Tools
What is age-adjustment?
Age-adjustment is a statistical process applied to rates of disease, death, injuries or other health outcomes which allows communities with different age structures to be compared.
Why do we do age-adjustment?
Almost all diseases or health outcomes occur at different rates in different age groups. Most chronic diseases, including most cancers, occur more often among older people. Other outcomes, such as many types of injuries, occur more often among younger people. The age distribution determines what the most common health problems in a community will be. One way of examining the pattern of health outcomes in communities of different sizes is to calculate an incidence or mortality rate, which is the number of new cases or deaths divided by the size of the population. In chronic diseases and injuries, rates are usually expressed in terms of the number of cases/deaths per 100,000 people per year.
A community made up of more families with young children will have a higher rate of bicycle injuries than a community with fewer young children. A community with more older individuals will have higher rates of cancer than one with younger individuals. This is true even if the individuals in the two communities have the same risk of developing cancer or being injured. Epidemiologists refer to this as confounding. Confounding happens when the measurement of the association between the exposure and the disease is mixed up with the effects of some extraneous factor (a confounding variable). See the attached example of age confounding. Age-adjustment is a statistical way to remove confounding caused by age.
How is age-adjustment done?
Age confounding occurs when the two populations being compared have different age distributions and the risk of the disease or outcome varies across the age groups. The process of age-adjustment by the direct method changes the amount that each age group contributes to the overall rate in each community, so that the overall rates are based on the same age structure. Rates that are based on the same age distribution can be compared to each other without the presence of confounding by age. Adjustment is accomplished by first multiplying the age-specific rates of disease by age-specific weights. The weights used in the age-adjustment of cancer data are the proportion of the 1970 US population within each age group. The weighted rates are then summed across the age groups to give the age-adjusted rate. Age-adjustment is demonstrated here using the cancer mortality rates for all sites of cancer among men in New York State in 1994. Age confounding is demonstrated using the prostate cancer mortality rates among white and black men in 1994.
Example of Age-Adjustment:
| Age Group | Number of Deaths (a) |
Population (Millions) (b) |
Rate per 100,000 (c=(a / b) x 100,000) |
Weight (d) |
Weighted Rate (cxd) |
|---|---|---|---|---|---|
| 0-14 | 62 | 1.95 | 3.2 | 0.284 | 0.91 |
| 15-24 | 82 | 1.21 | 6.8 | 0.174 | 1.18 |
| 25-34 | 303 | 1.48 | 20.9 | 0.123 | 2.57 |
| 35-44 | 686 | 1.40 | 49.0 | 0.113 | 5.54 |
| 45-54 | 1630 | 1.02 | 159.8 | 0.114 | 18.22 |
| 55-64 | 3457 | 0.73 | 475.9 | 0.091 | 43.31 |
| 65-74 | 6352 | 0.58 | 1093.4 | 0.061 | 66.70 |
| 75-84 | 5443 | 0.29 | 1878.3 | 0.030 | 56.35 |
| 85+ | 2050 | 0.07 | 2841.5 | 0.007 | 19.89 |
| Total | 20065 | 8.73 | 229.8 | 1.00 | 214.7 |
The crude (unadjusted) cancer mortality rate is 229.8 deaths per 100,000 men. The age-adjusted rate is 214.7 deaths per 100,000 men.
Example of confounding by age:
In Upstate New York (New York State, excluding New York City), 1,359 white men and 121 black men died from prostate cancer in 1994. Based on how many white and black men lived in Upstate in 1994, the crude (unadjusted) prostate cancer mortality rates were as follows:
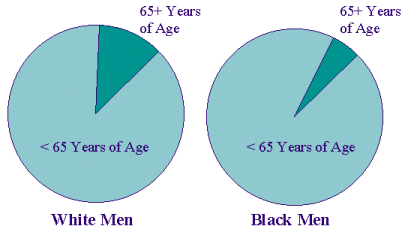
It appears based on this that white men and black men who reside in Upstate New York have the same prostate cancer mortality rate. But this is deceiving because black men in Upstate New York tend to be younger than white men:
When the number of deaths are examined by age group, a very different picture emerges:
In both the older and younger age groups, the prostate cancer mortality rate among black men is over two times higher than among white men. The age-adjusted rates reflect the higher risk among black men of dying from prostate cancer:
