New York State Chronic Hepatitis C Surveillance Summary - 2001-2004
The data presented in this summary should be interpreted with caution. These data do not represent incidence or prevalence of chronic hepatitis C in New York State, rather the data represent an aggregate of cases reported to the local and state health departments by laboratories and healthcare providers from 2001-2004. New York City data are not included in the NYSDOH chronic hepatitis disease registry. The data are dynamic, and this summary is current as of October 20, 2005.
Chronic Hepatitis C Virus (cHCV) Registry Data - Excluding Inmates
Table 1: Confirmed cHCV Statewide by Report Year
| Report Year | Case Count |
|---|---|
| 2001 | 3185 |
| 2002 | 4236 |
| 2003 | 5345 |
| 2004 | 6131 |
| TOTAL | <18897 |
Table 2: Confirmed cHCV Statewide by Age Group and Gender *
| Age Group | Male | Female | Total | |||
|---|---|---|---|---|---|---|
| N | % | N | % | N | % | |
| < 2 | 1 | 0.01 | 3 | 0.02 | 4 | 0.02 |
| 2-5 | 6 | 0.03 | 5 | 0.03 | 11 | 0.06 |
| 6-10 | 6 | 0.03 | 9 | 0.05 | 15 | 0.08 |
| 11-15 | 13 | 0.07 | 7 | 0.04 | 20 | 0.11 |
| 16-20 | 58 | 0.31 | 83 | 0.45 | 141 | 0.76 |
| 21-30 | 375 | 2.02 | 305 | 1.64 | 680 | 3.65 |
| 31-40 | 1343 | 7.22 | 976 | 5.25 | 2319 | 12.46 |
| 41-50 | 5310 | 28.54 | 2647 | 14.23 | 7957 | 42.76 |
| 51-60 | 3936 | 21.15 | 1634 | 8.78 | 5570 | 29.83 |
| >60 | 994 | 5.34 | 896 | 4.82 | 1890 | 10.16 |
| Total | 12042 | 64.72 | 6565 | 35.28 | 18607 | 100.0 |
| *N missing age or gender = 238 | ||||||
Figure 2: Confirmed cHCV Statewide by Race *
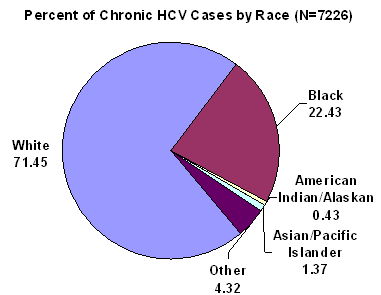
*N missing race = 11671
