New York State Chronic Hepatitis C Surveillance Summary - 2001-2005
Chronic Hepatitis C Virus (cHCV) Registry Data - Excluding Inmates
The data presented in this summary should be interpreted with caution. These data do not represent incidence or prevalence of chronic hepatitis C in New York State, rather the data represent an aggregate of cases reported to the local and state health departments by laboratories and healthcare providers from 2001-2005. New York City data are not included in the NYSDOH chronic hepatitis disease registry. The data are dynamic, and this summary is current as of May 25, 2006.
Table 1: Confirmed cHCV Statewide by Report Year
| Report Year | Case Count |
|---|---|
| 2001 | 3293 |
| 2002 | 4387 |
| 2003 | 5542 |
| 2004 | 6420 |
| 2005 | 6102 |
| TOTAL | <25744 |
Table 2: Confirmed cHCV Statewide by Age Group and Gender*
| Age Group | Male | Female | Total | |||
|---|---|---|---|---|---|---|
| N | % | N | % | N | % | |
| < 2 | 1 | 0.0 | 6 | 0.0 | 7 | 0.1 |
| 2-5 | 6 | 0.0 | 8 | 0.0 | 14 | 0.1 |
| 6-10 | 8 | 0.0 | 14 | 0.1 | 22 | 0.1 |
| 11-15 | 19 | 0.1 | 16 | 0.1 | 35 | 0.1 |
| 16-20 | 95 | 0.4 | 121 | 0.5 | 216 | 0.9 |
| 21-30 | 581 | 2.3 | 508 | 2.0 | 1089 | 4.3 |
| 31-40 | 1900 | 7.5 | 1364 | 5.4 | 3264 | 12.8 |
| 41-50 | 7177 | 28.2 | 3616 | 14.2 | 10793 | 42.4 |
| 51-60 | 5312 | 20.9 | 2209 | 8.7 | 7521 | 29.6 |
| >60 | 1319 | 5.2 | 1149 | 4.5 | 2468 | 9.7 |
| Total | 16418 | 64.6 | 9011 | 35.4 | 25429 | 100.0 |
| *N missing age or gender=315 | ||||||
Figure 2: Confirmed cHCV Statewide by Race*
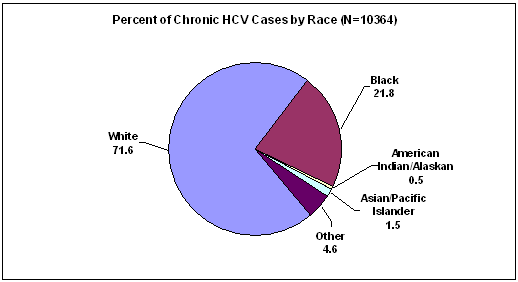
*N missing race = 15380
