Love Canal Follow-up Health Study - Mortality Community Report
- Love Canal Follow-up Health Study - Mortality Community Report is also available in Portable Document Format (PDF)
This report summarizes the causes of death among Love Canal residents as compared to others in Niagara County, New York State, and to each other. These mortality (or death) results are part of the Love Canal Follow-up Health Study done by the New York State Department of Health.
About the Study
In 1996, the NYSDOH began gathering information for a comprehensive 20-year follow-up health study of Love Canal residents. The study (called the Love Canal Follow-up Study) is really four smaller studies. One focuses on death rates, one on cancer incidences and one on birth outcomes of a group of residents. The fourth measures and evaluates some Canal chemicals in their stored blood samples. The four studies are intended to stand alone and are based on information about the same group of Love Canal residents (called the Study Group). The four studies share common elements including the tracing (or search method) used to determine who was living or who had died among the Study Group, evaluating their likelihood of exposure to Canal chemicals, and computerizing information obtained from their earlier health status interviews. (See Love Canal Background Community Report for more details).
What We Did
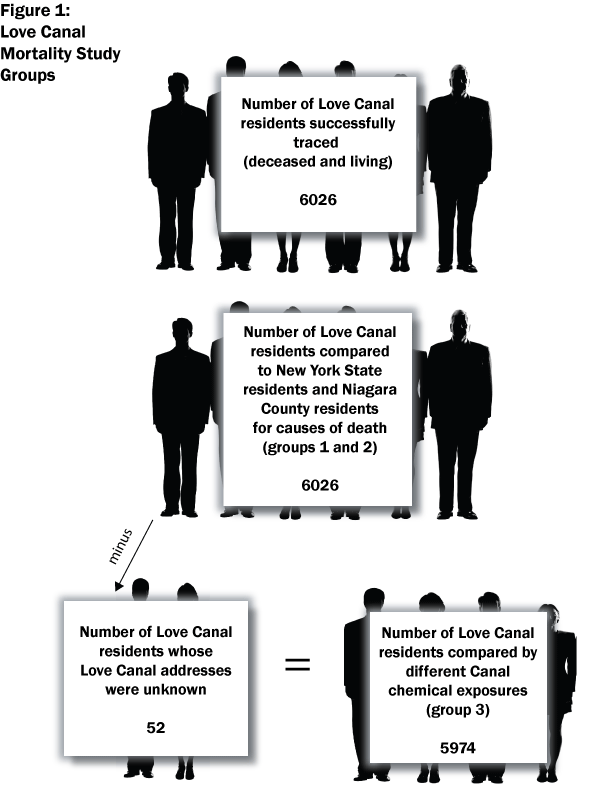
The mortality part of the follow-up study looked at former 6,026 Love Canal residents who were successfully traced (meaning that information was found telling us if the person had died or was still alive). We used New York State death certificates to find out who had died and from what causes. Since some residents had moved out of state, we also used the National Death Index which has the names of everyone who died anywhere in the United States. From those records, we learned how old people were at the time of death and the cause of death. From past interviews with NYSDOH between 1978 and 1982, we were able to determine which residents smoked, drank alcohol, or worked in jobs where they might have been exposed to chemicals. These factors are thought to increase a person's risk of dying.
We compared the information we got about the deaths in the Love Canal study group to deaths in three different groups of people from New York State (see Figure 1). The first group was people from New York State, not including New York City. New York State was chosen because the population is large enough so that the average number of deaths does not change much from year to year (death rates stay about the same). We did not include people from New York City because they are different than the rest of the state in many ways.
The second group of people from Niagara County was chosen because they are more like Love Canal residents. For example, they have the same kinds of jobs, they get their drinking water from similar sources, and they have the same selection of health care professionals completing death certificates. Due to limited space in articles, only the New York State group was used in the scientific journal as a comparison but differences in the Niagara County group were noted. Both groups, however, were included in the Agency for Toxic Substances and Disease Registry (ATSDR) report.
The third comparison group was the Love Canal residents themselves. We wanted to see if people who may have had different chemical exposures while in the Canal area had different causes of death. To compare these deaths, we looked at how long a person had lived in the Canal area, how close they lived to the Canal, and when they lived there.
What We Found
This study was not able to show differences in rates or overall causes of death in Love Canal from Niagara County or New York State for the years 1979 to 1996. There were some exceptions as discussed below. It is important to remember that we were not able to look at deaths before 1979 nor were we able to include all former Love Canal residents. The results are shown in Figure 2.
Generally, problems of the circulatory system (heart attacks, strokes) are the most common cause of death in New York State. This also appears to be true for former Love Canal residents. However, for heart attacks, Love Canal residents experienced a higher rate of death than others living in New York State but appears to be the same as others living in Niagara County.
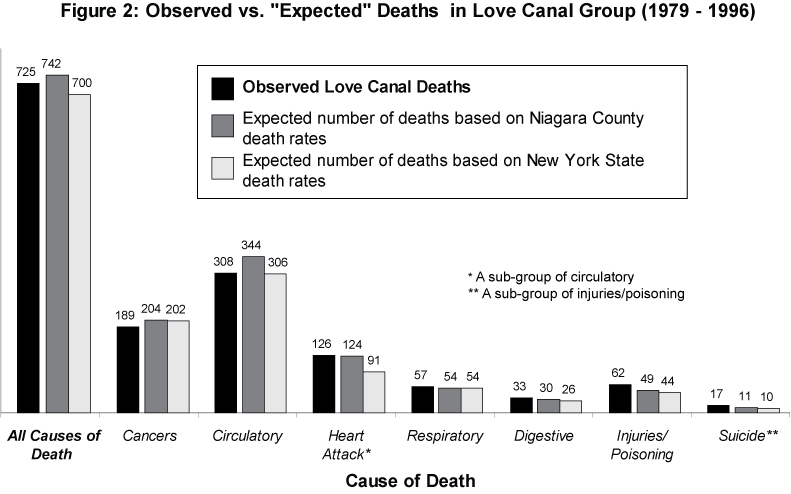
The second most common cause of death among the Love Canal residents, like other New Yorkers, was cancer. We found no differences in the rate of deaths due to cancer among Love Canal residents than would be expected of other New Yorkers or Niagara County residents. Another part of the follow-up health study looked at the number of people who developed cancer (whether or not they died from the disease). We will be reporting on this part of the study in the Cancer Community Report.
The third most common cause of death was external causes of injury and poisoning (suicides, car accidents, and other kinds of accidents). The rate of death from these causes was higher for Love Canal women than would be expected based on rates for other women in New York State or in Niagara County. We saw similar results for Love Canal men, but not as strongly (the difference in rates for women was greater than for men).
We looked at some causes of death to see how Love Canal residents compared to each other. We wanted to see if how close they lived to the Canal, how long they lived there, and when they lived there made any difference in the cause of death. Our results could not show that these factors made a difference. We did find, as would be expected, residents were more likely to die: as they got older, men at earlier age than women, and smokers sooner than non-smokers.
Conclusions
The study was not able to show that the overall death rate among Love Canal residents was different than expected based on death rates seen among people of the same age and sex in both Niagara County and New York State from 1979 to 1996. However there were some differences in causes of death. For example, deaths from suicides or accidents appeared to be more common among Love Canal residents than other residents of Niagara County or New York State. The reasons for this difference are not clear, but it could reflect the effects of exposure to Love Canal chemicals or of stress on the nervous system. We also saw more deaths from heart attacks among Love Canal residents than compared to New York State but not compared to Niagara County. This could be because Niagara County codes reasons of death differently than the rest of New York State, but the effects of Love Canal chemicals or of stress on the heart cannot be ruled out. There did not appear to be a link between where a person lived in the Love Canal area and their cause of death. In interpreting these results, one must recognize that the study was limited in that it did not include all Love Canal residents from 1942 to 1978 nor did it include deaths before 1979 or after 1996. As the Love Canal residents get older, other researchers may want to examine future mortality information and look at patterns in causes of death.
This report is one in a series of five intended to provide results of the Love Canal Follow-up Health Study. The five reports are Background, Mortality, Cancer, Reproductive, and Serum. These reports will be made available to the Love Canal community and others over the coming months. For More Information Contact:
Center for Environmental HealthBureau of Environmental & Occupational Epidemiology
Empire State Plaza-Corning Tower, Room 1203
Albany, New York 12237
