2013-14 Executive Budget
MRT Phase III Proposals and Global Cap Update
January 29, 2013
2:00 - 3:00 p.m.
- Proposal Presentation is also available in Portable Document Format (PDF, 774KB)
Overview
- New York State Budget Overview
- MRT Phase III Recommendations
- Recap of 2011-12 Medicaid Global Cap Results
- Components of $600 Million Annual Medicaid Global Spending Cap Growth in 2012-13
- Results through November 2012
- Successfully Maintaining the $15.9 Billion Global Cap
New York State Budget Overview
Current Financial Plan
SFY 2014 Executive Budget

Medicaid All Funds Spending
| ($ Millions) | ||||
|---|---|---|---|---|
| FY 2013 | FY 2014 | FY 2015 | FY 2016 | |
| State Funds | $21,783.7 | $22,445.8 | $23,238.7 | $24,514.6 |
| DOH State Funds | $15,911.7 | $16,421.3 | $16,977.6 | $17,804.6 |
| OSA State Funds | $5,872.1 | $6,024.4 | $6,261.1 | $6,710.1 |
| Federal Funds | $24,058.6 | $26,295.6 | $29,517.6 | $31,748.6 |
| Local Funds | $8,153.3 | $8,885.9 | $8,309.3 | $8,135.7 |
| All Funds | $53,995.6 | $57,627.3 | $61,065.5 | $64,398.9 |
Global Cap Spending Estimates
| ($ Millions) | ||||
|---|---|---|---|---|
| FY 2013 | FY 2014 | FY 2015 | ||
| Medicaid Services Spending Subject to CPI Trend | $15,320 | $15,913 | ||
| % Growth | 3.9% | |||
| BIP Shift to StOps (Exec. Budget Action) | ($10) | |||
| Medicaid Services Spending Subject to CPI Trend | $15,903 | $16,523 | ||
| % Growth | 3.9% | |||
| Adjustments | ||||
| LDSS Admin Ceiling | $545 | $545 | $545 | |
| State Operations - No Growth | $51 | $157 | $157 | |
| Local Medicaid Takeover (Including NYC) | $0 | $61 | $187 | |
| Monroe County Opt in Local Cap | $0 | ($183) | ($185) | |
| Admin Efficiency Savings - Discretionary | ($5) | ($22) | ($71) | |
| FFP | $0 | ($40) | ($179) | |
| Financial Plan | $15,912 | $16,421 | $16,978 | |
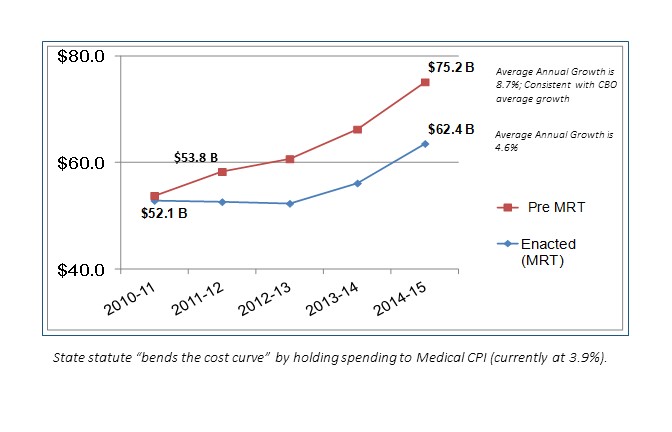
Medicaid Growth Before & After MRT (2010-11 Base Year)
MRT Phase III Recommendations
MRT Phase III Recommendations
| Fiscally Neutral Package of Savings and Investments | ||||
|---|---|---|---|---|
| $ in Millions -- Investments (Savings) | 2013-14 Gross |
2013-14 State |
2014-15 Gross |
2014-15 State |
| Supportive Housing | $12.50 | $12.50 | $12.50 | $12.50 |
| Payment Reform (VAP/SN, NH Quality Pool) | $62.00 | $31.00 | $39.00 | $19.50 |
| Health Home Investments | $25.08 | $17.02 | $10.08 | $5.04 |
| Integration of Behavioral & Physical Health Clinic Services | $15.00 | $7.50 | $15.00 | $7.50 |
| MLTC Quality Incentive | $20.00 | $10.00 | $20.00 | $10.00 |
| Balance Incentive Program Implementation | $20.00 | $10.00 | $0.00 | $0.00 |
| Various Pharmacy Saving Initiatives | ($26.51) | ($13.27) | ($35.66) | ($17.83) |
| Spousal Support | ($68.60) | ($34.30) | ($137.00) | ($68.50) |
| All Other Investments/Savings Initiatives | $3.58 | $2.27 | ($4.40) | ($1.26) |
| Federal Health Care Reform | $0.00 | ($43.00) | $0.00 | ($43.00) |
| Repeal Family Health Plus | $0.00 | $0.00 | ($106.00) | ($38.50) |
| Medicaid Benchmark Plan | $0.00 | $0.00 | $307.00 | $115.13 |
| Net MRT Phase III Recommendations | $63.05 | ($0.28) | $120.52 | $0.58 |
Supportive Housing
- Dedicate $91 million to expand access to supportive housing services:
- Continue $75 million in MRT dollars to fund various supportive housing initiatives;
- Allocate $12 million in new funds; and
- Designate $4 million for fund new supportive housing initiatives associated with Medicaid savings derived from the closure of hospital and nursing home beds.
Payment Reform
- Increase funding for Essential Community Provider Network and Vital Access Providers:
- Total VAP/SN Pool will increase to $182 million in 2013-14 and $153 million in 2014-15.
- Includes reallocation of $30 million from the NH Financially Disadvantaged Program to the VAP/SN Pool for Nursing Homes.
- Increase Nursing Home Quality Pool:
- From $50 million to $60 million in 2013-14.
- Develop Price for Specialty Nursing Homes:
- $5 million allocated in 2014-15 to help transition to the new price.
Health Homes and Health Clinic Investments
- Health Homes Infrastructure Development and Governance Support Grants:
- 1 year funding of $15 million in 2013-14.
- Distributed based upon lack of prior access to HEAL funding and Federal Innovation Grants.
- Health Home Plus Design targeted at AOT/State Psychiatric Center Discharges:
- $10 million will primarily be used to support patient case loads.
- Integration of Behavioral and Physical Health Clinic Services ($15 million)
MLTC Quality Incentive/BIP Implementation
- MLTC Quality Incentive:
- $20 million will be paid to plans that have high levels of performance (quality, satisfaction, and plan performance).
- Balance Incentive Program Implementation:
- BIP is a provision of ACA to provide enhanced long term services which will allow NYS to receive significant enhanced FMAP (roughly $200 million).
- 1 year funding of $20 million in state operations costs.
Various Pharmacy Savings
- Eliminate Prescriber Prevails ($21 million):
- Atypical antipsychotic drug class (MCOs).
- All drug classes (FFS).
- Opioids in excess of 4 prescriptions in a 30-day period.
- Reduce Pharmacy FFS Reimbursement Rate ($4 million)
- Tighten Early Fill Edit ($1 million):
- Refill when medication on hand is equal or less than a 7-day supply.
- Require Minimum Supplemental Rebates for Brand Drugs ($1 million)
All Other Investments (Savings)
- Spousal Support:
- Requires spouses to contribute to cost of care.
- Basic Benefit Review Workgroup:
- Expand tobacco cessation counseling to dentists.
- Discontinue coverage for lumbar discography.
- Limit coverage of Transcutaneous Nerve Stimulation to pain associated with knee osteoarthritis.
- Discontinue coverage for implantable infusion pumps for non-cancer pain.
All Other Investments (Savings)
- Indigent Care Pool Reform:
- Brings methodology into compliance with Federal DSH requirements and strengthens Financial Aid Law.
Federal Health Care Reform
- Additional FFP for childless adults in January 2014:
- $83 million in savings -- $43 million dedicated for Medicaid initiatives and $40 million used to support the Financial Plan.
- Repeal Family Health Plus ($106 million in savings):
- FHP enrollees will be subsumed into the new Medicaid eligibility category starting in January 2014.
- Define Medicaid Benchmark Plan as the Current Medicaid Benefit ($307 million in costs):
- Requires new adult eligibility group to be enrolled into a benchmark plan starting in January 2014.
Article VII Highlights
- Global Cap and 2% ATB reduction extended through March 2015.
- NH wage parity to create a "wage floor" to protect workers on the move to managed care
- Medicaid State Operations spending is consolidated within the Global Cap.
- Shift CHP rate setting to DOH.
- Eliminate all statutory barriers to "Care Management for All."
- Authorize Developmental Disability Individual Support and Care Coordination Organizations (DISCOs).
Recap of 2011-12 & 2012-13 Global Cap
Recap of 2011-12 Global Cap
- Spending under the 2011-12 Global Cap was $14 million below the $15.3 billion target.
- Accounts receivable balance totaled $575 million as of March 31, 2012:
- Peaked at over $750 million in January 2012.
- Health care coverage was provided to an additional 154,000 fragile and low income recipients:
- Medicaid Managed Care enrollment increased by 230,000 recipients.
- Fee for Service enrollment decreased by 76,000 recipients.
Components of $600M Annual Growth in 2012-13
- Annual growth of $600 million over last year includes costs associated with both price and enrollment increases, offset by a net change in one- time revenue and spending actions as well as the continuation of MRT initiatives.
| Price (+$363 million) | Price includes an increase in managed care premiums and fee-for- service pharmacy costs, as well as various inpatient and outpatient rate changes. |
| Utilization (+$433 million) | Utilization reflects the annualization of 2011-12 net enrollment growth (154,000 recipients) as well as assumed new enrollment for 2012-13 (ranging from 90,000 to 120,000 recipients; excluding the additional Child Health Plus enrollees estimated at 95,000). |
| One-Timers (−$67 million) | One-Timers primarily include the loss of enhanced FMAP which expired in June 2011 (+$703 million), offset by 53rd Medicaid cycle in 2011-12 (-$325 million) and accounts receivable recoupments in 2012-13 (-$259 million). |
| MRT/Other (−$129 million) | Other reflects the annualization of MRT Phase I savings ($156 million) offset by MRT Phase II initiatives ($27 million). |
Results through November 2012
- Medicaid expenditures through November 2012 are $46 million or 0.4% below projections.
| Medicaid Spending November 2012 (dollars in millions) | |||
|---|---|---|---|
| Category of Service | Estimated | Actual | Variance |
| Total Fee For Service | $7,630 | $7,627 | ($3) |
| Inpatient | $2,086 | $2,072 | ($14) |
| Outpatient/Emergency Room | $359 | $351 | ($8) |
| Clinic | $428 | $441 | $13 |
| Nursing Homes | $2,269 | $2,265 | ($4) |
| Other Long Term Care | $1,251 | $1,262 | $11 |
| Non-Institutional | $1,238 | $1,236 | ($2) |
| Medicaid Managed Care | $6,085 | $6,089 | $4 |
| Family Health Plus | $619 | $616 | ($4) |
| Medicaid Administration Costs | $372 | $330 | ($42) |
| Medicaid Audits | ($237) | ($239) | ($2) |
| All Other | $823 | $825 | $2 |
| Local Funding Offset | ($4,897) | ($4,897) | $0 |
| TOTAL | $10,396 | $10,351 | ($46) |
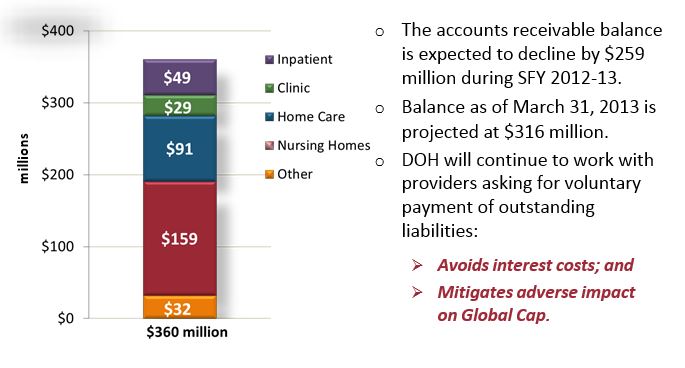
A/R Balance - January 2013
Medicaid Enrollment
- Medicaid total enrollment reached 5,240,040 enrollees at the end of November 2012. This reflects an increase of roughly 191,700 enrollees (includes 74,300 Child Health plus recipients), or 3.8%, since March 2012.

| Month/Year | Total Medicaid Enrollees |
|---|---|
| Feb-11 | 4,860,860 |
| Mar-11 | 4,890,367 |
| Apr-11 | 4,892,180 |
| May-11 | 4,904,134 |
| Jun-11 | 4,924,235 |
| Jul-11 | 4,922,796 |
| Aug-11 | 4,940,274 |
| Sep-11 | 4,953,987 |
| Oct-11 | 4,958,862 |
| Nov-11 | 4,970,284 |
| Dec-11 | 4,977,413 |
| Jan-12 | 4,998,551 |
| Feb-12 | 5,023,001 |
| Mar-12 | 5,048,295 |
| Apr-12 | 5,062,989 |
| May-12 | 5,084,054 |
| Jun-12 | 5,093,895 |
| Jul-12 | 5,116,463 |
| Aug-12 | 5,149,788 |
| Sep-12 | 5,170,969 |
| Oct-12 | 5,216,057 |
| Nov-12 | 5,240,040 |
MMC/FHP Enrollment
- Medicaid Managed Care enrollment in November 2012 reached 3,837,839 enrollees, an increase of almost 246,500 enrollees (includes 74,300 Child Health plus recipients), or 6.9%, since March 2012.

| Month/Year | Total Managed Care (73% of Total Enrollees) |
Fee for Service (27% of Total Enrollees) |
|---|---|---|
| Feb-11 | 3,346,942 | 1,513,918 |
| Mar-11 | 3,361,399 | 1,528,968 |
| Apr-11 | 3,366,787 | 1,525,393 |
| May-11 | 3,384,854 | 1,519,280 |
| Jun-11 | 3,415,833 | 1,508,402 |
| Jul-11 | 3,425,297 | 1,497,499 |
| Aug-11 | 3,445,921 | 1,494,353 |
| Sep-11 | 3,456,416 | 1,497,571 |
| Oct-11 | 3,452,435 | 1,506,427 |
| Nov-11 | 3,483,677 | 1,486,607 |
| Dec-11 | 3,508,113 | 1,469,300 |
| Jan-12 | 3,540,011 | 1,458,540 |
| Feb-12 | 3,575,817 | 1,447,184 |
| Mar-12 | 3,591,307 | 1,456,988 |
| Apr-12 | 3,611,698 | 1,451,291 |
| May-12 | 3,662,693 | 1,421,361 |
| Jun-12 | 3,680,780 | 1,413,115 |
| Jul-12 | 3,713,207 | 1,403,256 |
| Aug-12 | 3,760,496 | 1,389,292 |
| Sep-12 | 3,786,642 | 1,384,327 |
| Oct-12 | 3,815,673 | 1,400,384 |
| Nov-12 | 3,837,839 | 1,402,201 |
Status of Local Administration Takeover Implementation
- The State continues to achieve significant milestones in the takeover of local administration:
- By the end of SFY 2013, the Enrollment Center will operate in 31 counties to directly recertify individuals in Medicaid and FHP.
- Six counties will be added in March 2013 (Allegany, Madison, Onondaga, Ontario, Steuben, and Wyoming).
- By the end of SFY 2013, the Enrollment Center will operate in 31 counties to directly recertify individuals in Medicaid and FHP.
- 85 additional State Admin FTEs have been filled:
- DOH anticipates the balance of new staff hired by the end of the SFY.
- The State realized $40 million in local administrative savings in FY 2012; anticipate FY 2013 to equal or exceed this value in additional savings.
Potential Risks to Global Cap
- School Supportive Health Services ($75 million)
- Pharmacy Rebates
- Medicaid Rate Packages
- APG Investments, CHHA Cap Reconciliation, GME Reconciliation
- Flu Epidemic
- More than 19,000 confirmed cases to date; an increase of 400% over last year
- Accounts Receivable Balances ($360 million as of January 2013)
- Impact of Hurricane Sandy
Keys to Successfully Maintaining the $15.9 Billion Global Cap
- Continue working collectively with the health care industries to:
- Shift less severe patients from the hospital and emergency room to more appropriate ambulatory/primary care settings;
- Better management of the dual-eligible (Medicaid-Medicare) population and control of Long Term Care spending;
- Shift Medicaid recipients from costly fee-for-service into Medicaid Managed Care where services are better coordinated and financial incentives are more rational; and
- Voluntarily repay over $350 million (as of January 2013) to the State for outstanding liabilities owed by providers.
Keys to Successfully Maintaining the $15.9 Billion Global Cap
- Centralized Medicaid administration.
- Improvement in economy will drive lower enrollment growth.
- Continued successful implementation of MRT Phase I and Phase II initiatives.
2013-14 Executive Budget MRT Phase III: Questions?
- If you have questions from today´s presentation, please join us on Twitter for an opportunity to ask questions and have them answered in real time.
- When: Tuesday, February 5, 2:00 PM - 3:00 PM
- How to participate in the live Twitter chat:
- If you´re not already on Twitter, join at www.twitter.com
- Follow the MRT on Twitter: @NewYorkMRT
- Login to Twitter between 2:00 PM and 3:00 PM on Tuesday, February 5
- Ask questions by including @NewYorkMRT and #NYMRT in your tweets
- You don´t have to tweet - you can watch the conversation just by following >@NewYorkMRT on Twitter - updates will show up in your news feed.
MRT: Additional Information
- MRT Website:
http://www.health.ny.gov/health_care/medicaid/redesign/ - Sign up for email updates:
http://www.health.ny.gov/health_care/medicaid/redesign/listserv.htm - ´Like´ the MRT on Facebook:
http://www.facebook.com/NewYorkMRT - Follow the MRT on Twitter:
@NewYorkMRT

Follow Us