Occupational Fatalities in New York State: 2005 and 2006 Update
- Occupational Fatalities in NYS: 2005 and 2006 update (PDF, 338KB, 4pp.)
From 2005 through 2006, there were 286 traumatic work-related deaths reported in New York State (NYS), excluding New York City (NYC). The New York State Department of Health (NYSDOH) collects information on work-related deaths through the Census of Fatal Occupational Injuries (CFOI) program and the Fatality Assessment and Control Evaluation (FACE) program. CFOI was created by the U.S. Bureau of Labor Statistics (BLS) to collect an accurate count of work-related fatalities. The FACE program is administered by NYSDOH in cooperation with the National Institute for Occupational Safety and Health (NIOSH). These programs collect work-related fatality data, identify contributing factors and develop and disseminate injury prevention strategies.
This update provides information on those deaths identified by the CFOI program for 2005 and 2006. Examples of FACE evaluations are provided to illustrate the public health approach to preventing future fatalities.
Fatal Occupational Injuries, 2005 and 2006
- A total of 286 traumatic work-related deaths occurred in NYS (excluding NYC) between 2005 and 2006, of which 151 (53%) occurred in 2005 and 135 (47%) occurred in 2006. These deaths account for approximately 2.5% (286/ 11,574) of all traumatic work-related deaths in the United States between 2005 and 2006.
- The majority of occupational fatalities occurred among males (256, 89.5%), with 30 (10.5%) deaths occurring among females. In 2005, there were 17 (11.3%) deaths among females, which was the largest number of females fatally injured in a single year since 1992 when the program began collecting data.
- While wage and salary workers represented the largest percentage of occupational fatalities (75.9%), nearly 20% of fatally injured workers were self-employed or working in a family business.
- Nearly half the occupational fatalities occurred among workers aged 35 to 54. There were nine deaths under the age of 20 (3.1%) years and 19 (6.6%) deaths over the age of 65 years.
- Approximately 78% of occupational fatalities were among Whites. Fatal injuries to Hispanic/Latino workers comprised the next largest percentage with 9.1% of the occupational fatalities recorded over the two-year period.
- Transportation accidents exceeded all other fatal events with 44% of occupational fatalities.
- Construction and transportation/warehousing industries exceeded all other industries in occupational fatalities with 19.9% and 19.2%, respectively.
Demographics
The majority of occupational fatalities occurred among males (89.5%), with 30 (10.5%) deaths occurring among females. In 2005, there were 17 (11.5%) deaths among females, which was the largest number of females fatally injured in a single year since 1992 when the program began collecting data.
Approximately three-quarters (75.9%) of the fatalities recorded in 2005 and 2006 were among wage and salary workers. The percent of self-employed/family business occupational fatalities decreased from approximately 30% between 2003 and 2004 (data not shown) to about 20% between 2005 and 2006; however, there were more fatalities in this group in 2006.
Nearly half the occupational fatalities were 35 to 54 years old. There were nine (3.4%) deaths under the age of 20 years. There has been a substantial increase in the number of deaths occurring among those over 55 years of age, with approximately 25% of the fatalities in this group for 2005 and 2006.
| 2005 | 2006 | Total (2005-2006) | |
|---|---|---|---|
| N(%) | N(%) | N(%) | |
| Total | 151 | 135 | 286 |
| Employee Status | |||
| Wage & salary worker | 119 (78.8) | 98 (72.6) | 217 (75.9) |
| Self-employed / family business | 26 (17.2) | 32 (20.7) | 58 (20.2) |
| Armed Forces | <3 (<1) | <3 (<1) | 3 (1.0) |
| Volunteer | 5 (3.3) | 3 (2.2) | 8 (2.8) |
| Sex | |||
| Male | 134 (88.7) | 122 (90.4) | 256 (89.5) |
| Female | 17 (11.3) | 13 (9.6) | 30 (10.5) |
| Age | |||
| <20 | 7 (4.6) | <3 (1.4) | 9 (3.1) |
| 20-24 | 14 (9.3) | 10 (7.4) | 24 (8.4) |
| 25-34 | 30 (19.9) | 17 (12.6) | 47 (16.4) |
| 35-44 | 35 (23.2) | 35 (25.9) | 70 (24.5) |
| 45-54 | 36 (23.8) | 30 (22.2) | 66 (23.1) |
| 55-64 | 24 (15.9) | 27 (20.0) | 51 (17.8) |
| 65-74 | 5 (3.3) | 10 (7.4) | 15 (5.2) |
| 75+ | 0 | 4 (3.0) | 4 (1.4) |
| Race / Ethnicity | |||
| White | 119 (78.8) | 105 (77.8) | 224 (78.3) |
| Black | 13 (8.6) | 8 (5.9) | 21 (7.3) |
| Asian | <3 (<1) | <3 (1.5) | 3 (1.0) |
| Other/ Unknown | 6 (4.0) | 6 (4.4) | 12 (4.2) |
| Hispanic | 12 (8.0) | 14 (10.4) | 26 (9.1) |
Event/Exposure
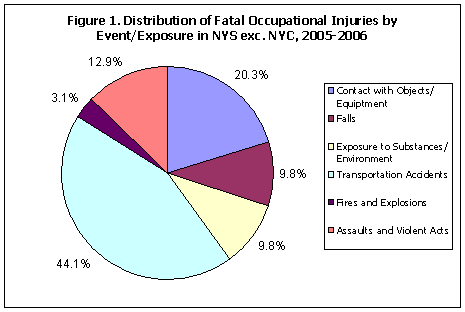
As shown in Figure 1, the leading causes of occupational fatalities were transportation accidents (44.1%); a small increase (<2%) since 2003 and 2004 (data not shown). Over 20% of deaths were the result of contact with objects or equipment, an increase from 12.5% in 2003 and 2004.
NY FACE Investigation 05NY039:
Three male highway paving workers sustained fatal injuries when struck by a passenger bus in a highway work zone. The work zone was demarcated by the required orange traffic cones and warning signs. The passenger bus driver attempted to brake approximately 0.2 miles before the work zone but was unable to stop. After striking a motorcycle and a tractor-trailer, the bus entered the work zone and struck the three victims who were working at the rear of a cement truck. One victim died at the scene. The other two victims died in a hospital. The NYS Department of Transportation inspected the bus after the incident and found several defects in the bus' brake system. The State Police determined that the primary cause of the collision was inadequate brakes and the secondary contributing causative factor was speeding within the work zone.
In order to prevent similar incidents from occurring in the future, NY FACE recommended that:
- Bus companies frequently inspect buses to insure that all parts and accessories function properly and train bus drivers regarding highway work zone safety issues; and
- Transportation administrative agencies consider requiring (1) reduced speed limits through work zones on highways with high traffic volume to protect workers; and (2) the use of protective barriers to shield workers from intruding vehicles, portable rumble strips/speed bumps on roadways to warn motorists of highway construction work zones and law enforcement officers to patrol work zones.
Occupation/Industry
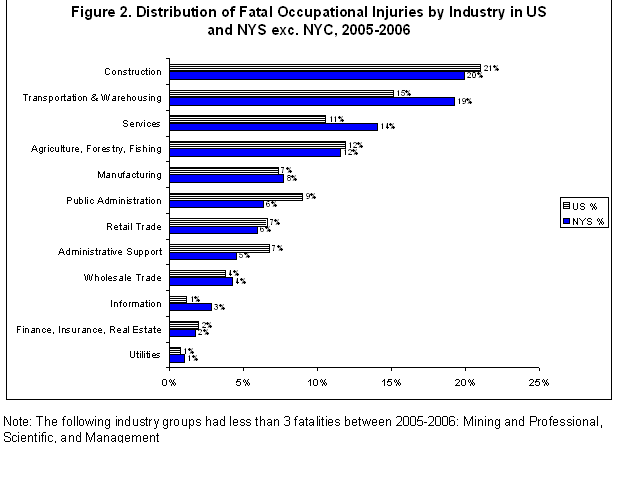
There were 57 occupational fatalities in NYS (excluding NYC ) among those employed in the construction industry (Table 2). The second highest number of deaths occurred in those employed in the transportation and warehousing industry (n = 55), followed by those employed in the services industry (n=40).
| NYS exc. NYC | U.S. Total (2005-2006) | |||
|---|---|---|---|---|
| 2005 | 2006 | Total (2005-2006) | ||
| N(%) | N(%) | N(%) | ||
| Total | 151 | 135 | 286 | 11,574 |
| Industry | ||||
| Agriculture, Forestry & Fishing | 11 (7.3%) | 22 (16.3%) | 33 (11.5%) | 1,370 (11.8%) |
| Utilities | <3 (<1%) | <3 (1.5%) | 3 (1.0%) | 83 (<1%) |
| Construction | 33 (21.9%) | 24 (17.8%) | 57 (19.9%) | 2,431 (21.0%) |
| Manufacturing | 9 (6.0%) | 13 (9.6%) | 22 (7.7%) | 849 (7.3%) |
| Wholesale Trade | 6 (4.0%) | 6 (4.4%) | 12 (4.2%) | 431 (3.7%) |
| Retail Trade | 11 (7.3%) | 6 (4.4%) | 17 (5.9%) | 759 (6.6%) |
| Transportation & Warehousing | 32 (21.2%) | 23 (17.0%) | 55 (19.2%) | 1,745 (15.1%) |
| Information | 4 (2.7%) | 4 (3.0%) | 8 (2.8%) | 131 (1.1%) |
| Finance & Insurance | 3 (2.0%) | <3 (1.5%) | 5 (1.7%) | 225 (1.9%) |
| Administrative Support | 7 (4.6%) | 6 (4.4%) | 13 (4.5%) | 779 (6.7%) |
| Services | 23 (15.2%) | 17 (12.6%) | 40 (14.0%) | 1,219 (10.5%) |
| Public Administration | 9 (6.0%) | 9 (6.7%) | 18 (6.3%) | 1,040 (9.0%) |
NY FACE Investigation 06NY010:
A 47-year-old equipment operator of an excavating company died after he was pinned to a tree by an excavator he was operating. The victim was operating the excavator at a residential building site at the time of the incident. The incident had no witness. The owner of the company found the victim pinned to a tree and crushed by the excavator; the excavator's safe lock lever was not activated. The owner turned the excavator to free the victim. As the excavator swung and freed the victim, it pinned the owner to the tree. The owner was able to reach the control to turn the excavator to free himself. The victim was pronounced dead at the scene. The owner suffered serious injuries but later recovered.
In order to prevent similar incidents from occurring in the future, NY FACE recommended that:
- Employers should ensure that equipment operators fully understand and strictly follow the safe operating procedures required by manufacturers, and conduct a job site survey to identify potential hazards and develop and implement appropriate control measures; and
- Excavator manufacturers should warn users of the potential hazards of not activating the lock lever, and designate an entire section or chapter in the operator's manual to address safety precautions and operating procedures.
There were 87 occupational fatalities among those with an occupation in transportation in NYS (excluding NYC), accounting for 30% of deaths during this time period (Figure 2). Workers in transportation occupations include bus and taxi drivers, crane operators and parking lot attendants. There were over 50 deaths among those with an occupation of construction or extraction, which includes carpenters, building inspectors and highway maintenance workers. These made up less than 20% of deaths in NYS (excluding NYC). Both of these occupations show increases in the number of fatalities compared to 2003 and 2004 (25% and 16%, respectively; data not shown).
Occupational Fatality Reporting
The NYS CFOI and FACE programs utilize multiple sources to identify, verify and profile occupational fatalities. Multiple sources are used to enable both programs to provide as complete and accurate information concerning workplace fatalities as possible.
Further information about the New York State Department of Health CFOI and FACE Programs, including complete NY FACE reports can be found on-line at:
- Census of Fatal Occupational Injuries (CFOI)
- New York Fatality Assessment and Control Evaluation (NY FACE)
If you know of a work related death, you should report it to the New York State Department of Health at: 1-866-807-2130 (toll-free)
References
- NYS data do not include New York City fatalities. New York City collects and analyzes fatal occupational injury data separately.
