Redesign Medicaid in New York State
Medicaid Redesign Team Update and Next Steps
- Presentation is also available in Portable Document Format (PDF, 1.1MB)
Significant Progress, Lots Still to Be Done
May 14, 2013
Citizens Budget Commission
Jason A. Helgerson, Medicaid Director
NYS Department of Health
Last Time I Visited ...
- May 6, 2011
- MRT had just completed Phase 1.
- We had a plan to lower Medicaid spending by $4 billion (gross) in FY 11-12.
- The Phase 1 proposal had broad stakeholder support but we still needed a comprehensive, multi-year action plan.
- The state legislature approved virtually the entire MRT Phase 1 plan as part of the first on time budget in years.
- Implementation had just begun. We had a long way to go!
Looking Back: Why the MRT?
- Medicaid spending was set to rise at an unsustainable rate (13%).
- Certain parts of the program were really driving costs.
- Overall program quality was average, compared to other states, but in certain areas quality was poor:
- 50th in inappropriate hospitalizations.
- Bottom line: Taxpayers were not getting their money´s worth and patients were not adequately cared for by the program.
- New York also had a Medicaid political problem.
- Reform efforts had been stymied for years due to a divisive political culture around Medicaid and general dysfunction in Albany.
- Governor Cuomo realized this and decided he needed a "game changer".
- MRT changed the game by bringing all the stakeholders to the table to develop a consensus plan:
- No plan, cuts would occur anyway.
- Few thought it would work.
What Were The Key Problems Facing MRT?
- Spending
- Health Care Quality
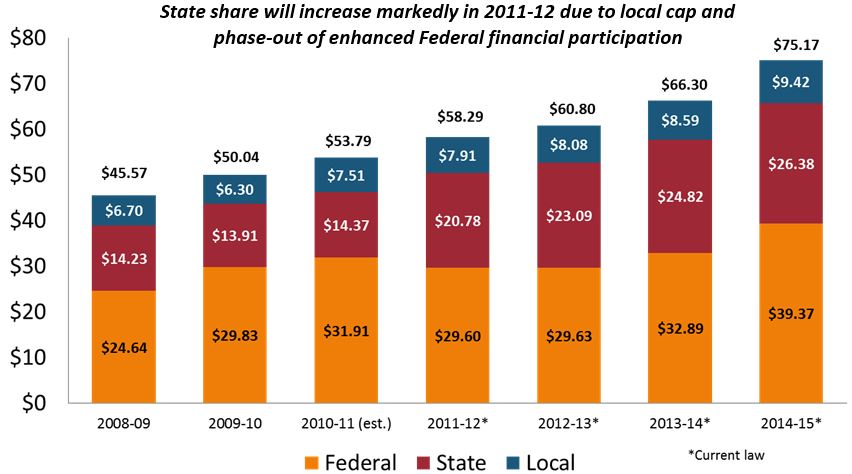
Overview - Historical Medicaid Spending ($ in Billions)
State of LTC Medicaid Spending
(Trend - Spending up 26%; Recipients Flat)
| LTC Per Recipient Spending Trends by Service ($ 000) | |||||||||
|---|---|---|---|---|---|---|---|---|---|
| 2003 | 2009 | % Change In Per Recipient Spending 2003 to 2009 |
|||||||
| # of Recipients | Total ($) | $ Per Recipient | # of Recipients | Total ($) | $ Per Recipient | ||||
| Nursing Homes | 139,080 | $5,946,989 | $42,759 | 128,377 | $6,345,047 | $49,425 | 15.6% | ||
| ADHC | 16,365 | 266,248 | 16,269 | 22,954 | 461,442 | 20,103 | 23.6% | ||
| LTHHCP | 26,804 | 510,250 | 19,036 | 26,572 | 695,666 | 26,180 | 37.5% | ||
| Personal Care | 84,823 | 1,824,729 | 21,512 | 75,023 | 2,232,735 | 29,761 | 38.3% | ||
| MLTC | 12,293 | 444,341 | 36,146 | 33,826 | 1,219,055 | 36,039 | -0.3% | ||
| ALP | 3,538 | 50,488 | 14,270 | 4,720 | 86,028 | 18,226 | 27.7% | ||
| Home Care/CHHA | 92,553 | 760,347 | 8,215 | 86,641 | 1,349,000 | 15,570 | 89.5% | ||
| Total | 318,617 | $9,803,392 | $30,769 | 318,984 | $12,388,973 | $38,839 | 26.2% | ||
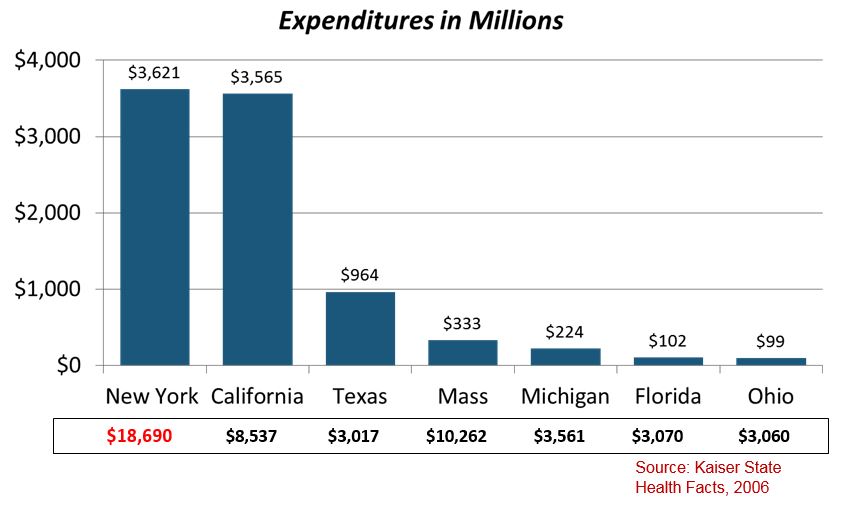
State of LTC Medicaid Spending
NYS Home Care and Personal Care Spending Exceeds All Other States
Quality of Care
High Needs + Poor Care Management = High Costs
State of Quality: All Payer
New York has average performance key quality indicators...but ranks 50th in avoidable hospital use
2009 Commonwealth State Scorecard on Health System Performance
| CARE MEASURE | NATIONAL RANKING |
|---|---|
| Percentage of Uninsured Adults | 28th |
| Quality of Health Care | 22nd |
| Public Health Indicators | 17th |
| Avoidable Hospital Use and Cost • Percent home health patients with a hospital admission • Percent nursing home residents with a hospital admission • Hospital admissions for pediatric asthma • Medicare ambulatory sensitive condition admissions • Medicare hospital length of stay |
50th 49th 34th 35th 40th 50th |
NYS appears to be dealing with a systemic quality issue that stretches across payers and across health care deliver sectors.
State of Medicaid Spending High Cost Enrollees
| Clinical Risk Grouping for FFS-Only Non-Dual Eligible Recipients*** | Recipients | Pct Total Member Months | Sum Total Claim Expenditures CY2009 | Pct Total Claim Expenditures | Total Claim PMPM |
|---|---|---|---|---|---|
| Healthy/Acute | 685,922 | 67.02 | $ 1,145,627,952.09 | 9.49 | $ 251.84 |
| Minor Chronic | 37,866 | 3.70 | $ 292,866,238.28 | 2.43 | $ 772.35 |
| Single Chronic | 135,991 | 13.29 | $ 2,299,827,552.72 | 19.05 | $ 1,788.58 |
| Pairs Chronic | 106,050 | 10.36 | $ 4,422,143,460.78 | 36.64 | $ 3,840.82 |
| Triples Chronic | 14,166 | 1.38 | $ 1,039,970,105.52 | 8.62 | $ 6,528.78 |
| Malignancies | 5,720 | 0.56 | $ 337,435,792.73 | 2.80 | $ 6,894.61 |
| Catastrophic | 10,035 | 0.98 | $ 1,112,572,535.35 | 9.22 | $10,044.17 |
| HIV / AIDS | 27,673 | 2.70 | $ 1,420,175,935.10 | 11.77 | $ 4,666.04 |
| Total | 1,023,423 | 100.00 | $ 12,070,619,572.57 | 100.00 | $ 1,510.96 |
*** FFS Only Non-Dual Recipients excludes Medicaid recipients with any MMC member months of eligibility during CY2009.
The MRT Response
Process/Final Product
MRT´s Response
- The MRT realized there was no "silver bullet" that would solve both the cost and quality issues in Medicaid.
- Several initiatives needed to be launched (78 distinct proposals in Phase 1 alone) to achieve savings while also improving patient outcomes.
- Follow the money. MRT knew that high cost/high needs members were the primary cost drivers and that was a direct result of a failure to effectively "manage" their needs.
- The team also understood that Medicaid redesign needed to be implemented in concert with the Affordable Care Act (ACA). The state and federal government had to be on the same page.
- The team realized that no sector of the program could be immune from reform. Everyone needed to be part of the solution.
The MRT Process
THE MRT WORKED IN TWO PHASES
| Phase 1 | Phase 2 |
|---|---|
| Provided a blueprint for lowering Medicaid spending in state fiscal year 2011-12 by $2.2 billion. | Developed a comprehensive multi-year action plan to fundamentally reform the Medicaid program. |
- This is the first effort of its kind in New York State.
- By soliciting public input and bringing affected stakeholders together, this process has resulted in a collaboration which reduces costs while focusing on improving quality and reforming New York´s Medicaid system.
The Final Product
- Most sweeping Medicaid reform plan in state history.
- Pulls together the work of the MRT into a single action plan.
- Plan is closely tied to successful implementation of the federal Affordable Care Act (ACA).
- The plan also embraces the CMS "triple aim" of: Improving care, improving health, and reducing costs.
Key Elements of the Plan
- Care Management for All: End the inefficient fee-for-service system which rewards volume over value. Replace it with a high quality system of "fully integrated" care management for all.
- Health Homes: Teams of providers working together to coordinate care for Medicaid´s most needy patients.
- Universal Access to High Quality Primary Care: 1.6 million Medicaid members use nationally accredited patient-centered medical homes. The goal is to enroll all Medicaid members within five years.
- Global Spending Cap: Active program management for the first time in state history. Fiscal accountability and transparency now exist in Medicaid.
- Targeting the Social Determinants of Health: Medicaid is now actively addressing issues such as housing and health disparities through innovative new strategies (example - supportive housing.)
MRT Implementation to Date
Are We Lowering Costs and Improving Outcomes?
MRT Implementation Status
| Phase 1 | Phase 2 |
|---|---|
| • 78 projects • 60 Complete or Substantively Complete • 12 In Progress • 5 Merged • 1 Cancelled |
• 124 projects • 20 Complete or Substantively Complete • 75 In Progress • 13 Merged • 1 Cancelled |
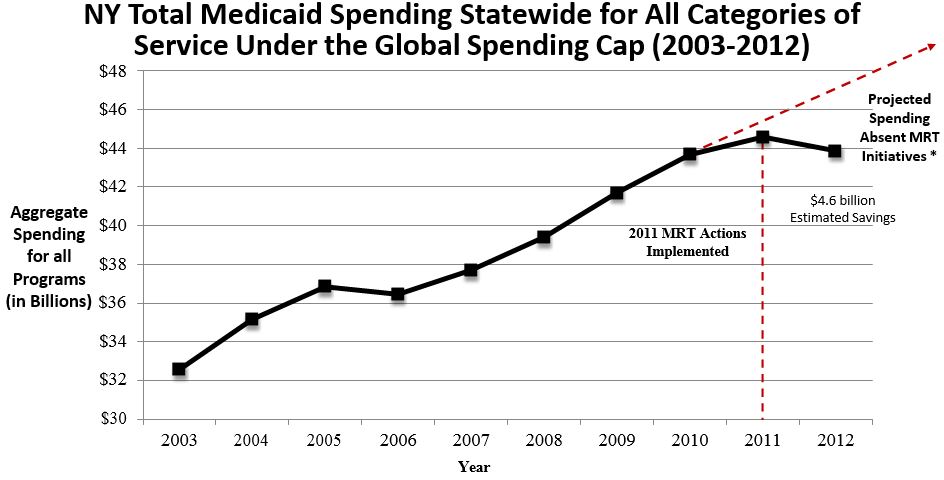
The MRT is Bending the Cost Curve
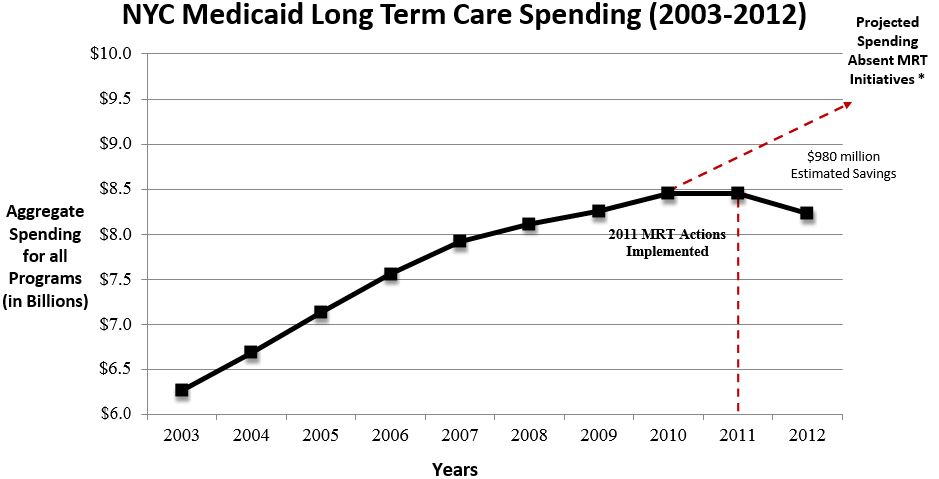
- Lowered total Medicaid spending by $4 billion in Year 1.
- Lived within the Global Spending Cap for two full years.
- Finished Year Two $200 million under the Global Spending Cap.
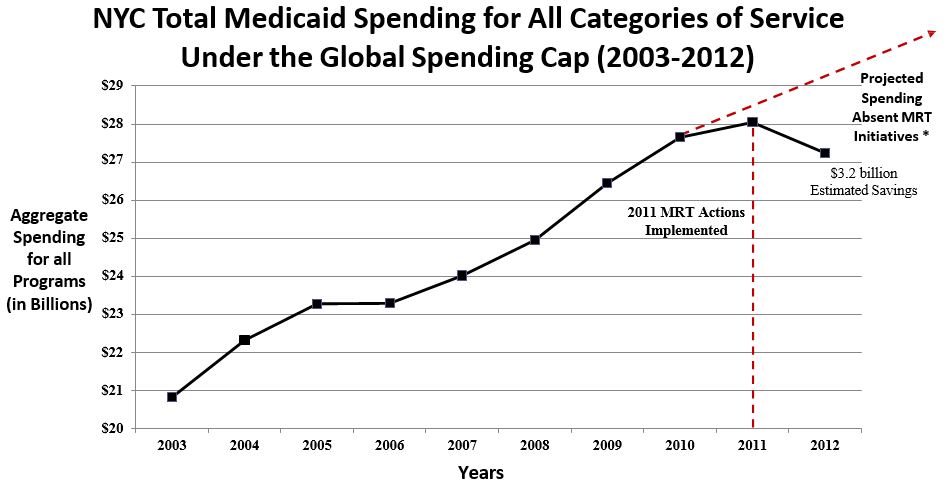
- Thanks to the MRT the state was able to absorb, with minimal reduction in provider reimbursement,
a $1.1 billion federal revenue loss due to a change in Medicaid financing for DD services. - Savings has been especially significant in New York City.
| 2003 | 2004 | 2005 | 2006 | 2007 | 2008 | 2009 | 2010 | 2011 | 2012 | |
|---|---|---|---|---|---|---|---|---|---|---|
| # of Recipients | 4,266,535 | 4,593,566 | 4,732,563 | 4,729,166 | 4,621,909 | 4,656,354 | 4,910,511 | 5,211,511 | 5,396,521 | 5,578,143 |
| Cost per Recipient | $7,635 | $7,658 | $7,787 | $7,710 | $8,158 | $8,464 | $8,493 | $8,379 | $8,261 | $7,864 |
*Projected Spending Absent MRT Initiatives was derived by using the average annual growth rate between 2003 and 2010 of 4.28%.
| 2003 | 2004 | 2005 | 2006 | 2007 | 2008 | 2009 | 2010 | 2011 | 2012 | |
|---|---|---|---|---|---|---|---|---|---|---|
| # of Recipients | 2,815,890 | 3,014,656 | 3,114,104 | 3,145,267 | 3,077,097 | 3,072,893 | 3,197,304 | 3,351,189 | 3,427,870 | 3,487,966 |
| Cost per Recipient | $7,397 | $7,406 | $7,477 | $7,406 | $7,807 | $8,121 | $8,272 | $8,251 | $8,183 | $7,810 |
* Projected Spending Absent MRT Initiatives was derived by using the average annual growth rate between 2003 and 2010 of 4.1%.
| 2003 | 2004 | 2005 | 2006 | 2007 | 2008 | 2009 | 2010 | 2011 | 2012 | |
|---|---|---|---|---|---|---|---|---|---|---|
| # of Recipients | 181,960 | 181,971 | 183,181 | 185,591 | 185,409 | 185,067 | 188,207 | 192,207 | 194,912 | 193,062 |
| Cost per Recipient | $34,438 | $36,726 | $38,933 | $40,732 | $42,700 | $43,841 | $43,867 | $43,977 | $43,363 | $42,629 |
* Projected Spending Absent MRT Initiatives was derived by using the average annual growth rate between 2003 and 2010 of 4.4%.
MRT is Improving Patient Outcomes
NYS Managed Care Plans #2 in the Nation
Example #1
- National Committee for Quality Assurance (NCQA) analyzed New York´s Medicaid health care plans against 76 different quality measures.
- NYS plans are especially successful when it comes to offering the right type of care for common, costly diseases, for example:
- Diabetes;
- Childhood obesity;
- Smoking cessation;
- Follow-up care for the mentally ill.
- NCQA found that New York is a national leader, second only to Massachusetts.
Source: NCQA: http://www.ncqa.org/Newsroom/NYStateofHealthCare.aspx
Managed Long Term Care Improving Patient Outcomes
Example #2
- MRT 90, Mandatory Enrollment in MLTC Plans: Expands MLTC for Medicaid members who are also eligible for Medicare (dual eligibles) and currently receiving community-based long term care services.
- Benefit package includes home care, personal care, social supports, and transportation services. The costs of skilled nursing facility services are included in the capitation payment, providing a financial incentive for the plans to keep their members healthy and living in the community.
- MLTC enrollment has steadily increased over the past couple years:
- Enrollment has increased from approximately 10,000 in 2004 to nearly more than 100,00 as of May 2013;
- Number of plans has grown from 16 plans to more than 40 plans.
- MLTC is improving outcomes and the feedback is favorable.
- The New York State Department of Health 2012 Managed Long Term Care (MLTC) Report found that:
- the overall functional ability of 90 percent of MLTC enrollees has remained stable or improved;
- 85 percent of MLTC plan members rated their health plan as "good" or "excellent";
- 91 percent would recommend their plan to a friend, and
- Less than 2 percent of members are in nursing homes.
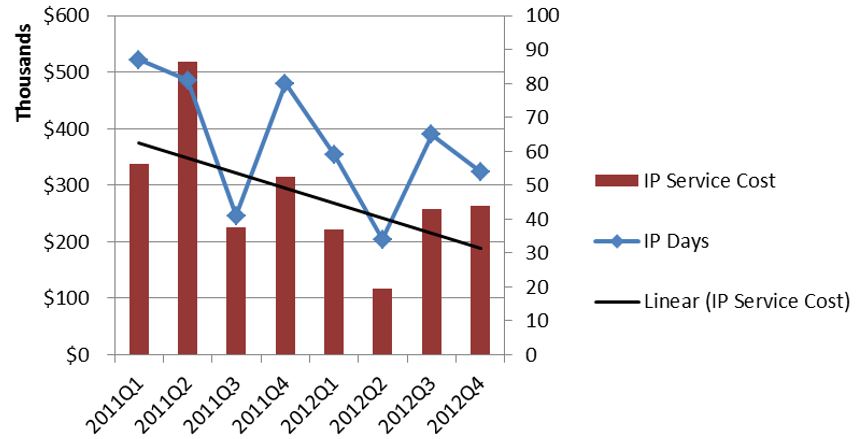
Health Homes Are Reducing Inpatient Utilization & ER Use
Example #3
- Health Homes are in their early days.
- Patients with little or no historic connection to traditional health care are benefiting the most.
- Preliminary results are for Phase 1 and Phase 2 counties.
Inpatient Service Cost for a Subset of Health Home Enrolled Members
Inpatient Services Utilization and Spending Dropping for Health Home Enrolled *
ER Service Cost for a Subset of Health Home Enrolled Members
Emergency Room Utilization and Spending Dropping for Health Home Enrolled *
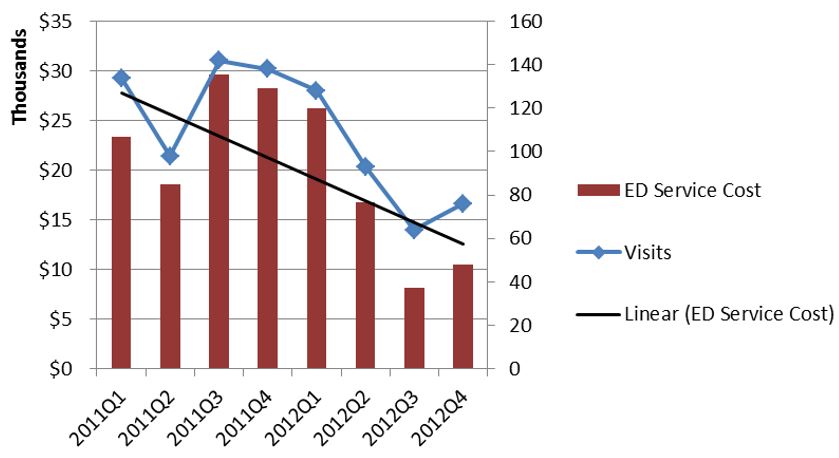
* Includes individuals continuously enrolled in Medicaid with no case management services in calendar 2011 who enrolled in Health Home Services in the first six months of 2012. N = 194 individuals.
2013 MRT Priorities
Priority 1: Continue MRT Implementation
- The MRT action plan will take five years to fully implement.
- Implementation of "Care Management for All" continues in 2013:
- Transition Community placed non-per diem Foster Care Children into Managed Care (April 2013);
- Transition LTHHCP into Managed Care;
- Transition the Nursing Home population (non-duals) into MMC (October 2013);
- Launch Special Needs Plans for people with significant and persistent mental illness (2014);
- Carve Behavioral Health services into Managed Care (2014).
- Complete the statewide implementation of the transportation management initiative.
- Continue statewide roll-out of health homes. By April of 2014 we expect 151,000 will be enrolled.
- Launch ACO´s statewide.
- Fund additional supportive housing efforts targeted at high needs Medicaid members.
- Continue to drill down into the Medicaid benefit package and propose additional benefit changes to ensure Medicaid members access the most cost-effective treatments.
- Implement the Vital Access Provider (VAP) program to assist vulnerable safety net providers transition to more sustainable business models that ensure access to essential services.
Priority 2: MRT Waiver Amendment
- We currently have a waiver amendment pending with CMS that would allow us to reinvest $10 billion in MRT generated federal savings back into New York´s health care delivery system.
- The amendment is essential to both fully implement the MRT action plan as well as prepare for ACA implementation.
- The amendment, which requires federal approval, is a unique opportunity to address the underlying challenges facing NYS health care delivery:
- Lack of primary care;
- Weak health care safety net;
- Health disparities; and
- Transition challenges to managed care.
Priority 3: FIDA Demonstration
- A key step in the move to "Care Management for All" is the proposed Fully Integrated Dual Advantage (FIDA) demonstration project.
- Through this effort approximately 170,000 dually eligible members (Medicaid and Medicare) will be enrolled into fully-integrated managed care products.
- The enrollment process will rely on a "conversion in place" approach under which duals enrolled in MLTCP will see their Medicare benefit added to their managed care plan´s portfolio.
- Members will be able to opt-out of the Medicare managed care product.
- Implementation = April 2014
Priority 4: Get the DD Financial Problems Behind Us
- The current system for financing services for developmental disability services is no longer appropriate and needs to be replaced.
- Replacing the system is complex and billions of dollars are at risk if the state can´t replace the system in a timely and reasonable fashion.
- The state is working with CMS to adjust rates and implement DD system reforms that will both lower federal costs for the system as well as improve patient outcomes.
Priority 5: ACA Implementation & Medicaid Administration Reform
- The Affordable Care Act (ACA) is a tremendous opportunity for New York State:
- 1 million New Yorkers will gain access to health insurance;
- Additional federal financing for Medicaid will help ensure program sustainability;
- Building a new health insurance exchange will allow the state to phase-out the out-of-date WMS eligibility system.
- New York will operate its own exchange and will use the launch of the exchange to also facilitate the state takeover of Medicaid administration from counties.
- State takeover will provide counties with mandate relief and create greater consistency in customer treatment across the state.
- Full state takeover will take five years to implement.
- Standing up the exchange by October 1, 2013 is a major challenge for DOH and our partners. Lots of work ahead!
Next Steps
- Thanks to the MRT we now have a multi- year action plan, a roadmap, for meaningful Medicaid reform.
- Need to get the MRT waiver amendment approved.
- Need to continue implementation of MRT action plan.
- Biggest risks are continued enrollment growth and potential federal cuts in Medicaid/Medicare.
Contact Information
We want to hear from you!
MRT website:
mrtwaiver@health.health.ny.gov
Subscribe to our listserv:
http://www.health.ny.gov/health_care/medicaid/redesign/listserv.htm
´Like´ the MRT on Facebook:
http://www.facebook.com/NewYorkMRT
Follow the MRT on Twitter:
@NewYorkMRT

Follow Us