Welcome and DSRIP Performance
Update: MY3 Preview (Month 9 of 12)
- Presentation is also available in Portable Document Format (PDF)
December 8, 2017
Achieving the DSRIP goal
25% reduction in avoidable hospital use over five years
- Potentially Preventable Readmission (PPR)
- Potentially Preventable ER Visits (PPV)
- Prevention Quality Indicators (PQI)
- Potentially Avoidable Complications (PAC)1
- Pediatric Quality Indicators (PDI)
___________________________________
1. PAC are not DSRIP payment measures, but are a component of NYS VBP Initiative and another way to quantify avoidable hospital use. PAC distinguish a wide variety of complications and calculates proxy price weighted, severity–adjusted episodes of care that can be bundled, such as the Chronic Bundle in NYS VBP.
|top of page|How have PPS performed so far?
PPS have reduced Potentially Preventable Readmissions by 16.5%
PPS have reduced Potentially Preventable ER Visits by 12.5%
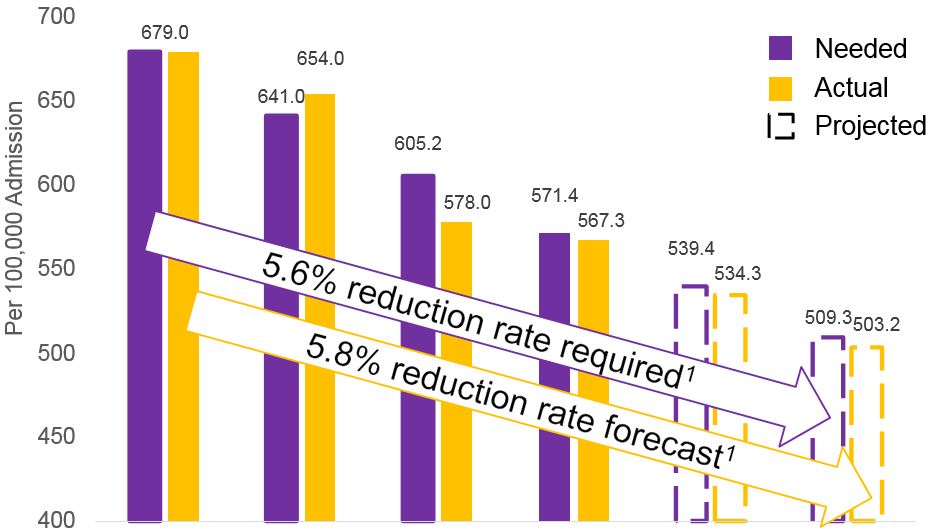
|top of page|PPR: Current results and performance opportunity
Potentially Preventable Readmission
| MY0 | MY1 | MY2 | MY31 | MY4 | MY5 | |
|---|---|---|---|---|---|---|
| Needed | 679.0 | 641.0 | 605.2 | 571.4 | 539.4 | 509.3 |
| Actual | 679.0 | 654.0 | 578.0 | 567.3 | 534.3 | 503.2 |
| Delta | 0.0 | −13.0 | 27.2 | 4.1 | 5.1 | 6.0 |
Pursuing the goal of 25% reduction...
If all PPS maintain current reduction rates, the State will achieve a 25.89% reduction over baseline (503.2 per 100,000 members)
MY2 annual CAGR was −7.7%, that rate is reduced to −5.8% when including MY3 data
| MY31 Rates | PPS |
|---|---|
| < −10% | NYU Lutheran (−24.81%), NCI, BHA, ACP, BHNNY, NY Presby, SIPPS, LCHP, Refuah, WMCH |
| −9.9% to − 0% | CNYCC, OneCity, CCN, AHI, NQP, SCC, BPHC, FLPPS |
| +0% to 10% | CCB, CPWNY, NYPQ, MCC, |
| >10% | MHVC, Mount Sinai, Alliance |
___________________________________
Notes:
1. Projection assumes a consistent denominator year over year, and rate estimates are based on CAGR projection driven by MY0 – MY3 non–case mix adjusted results with only three quarters of MY3 data included
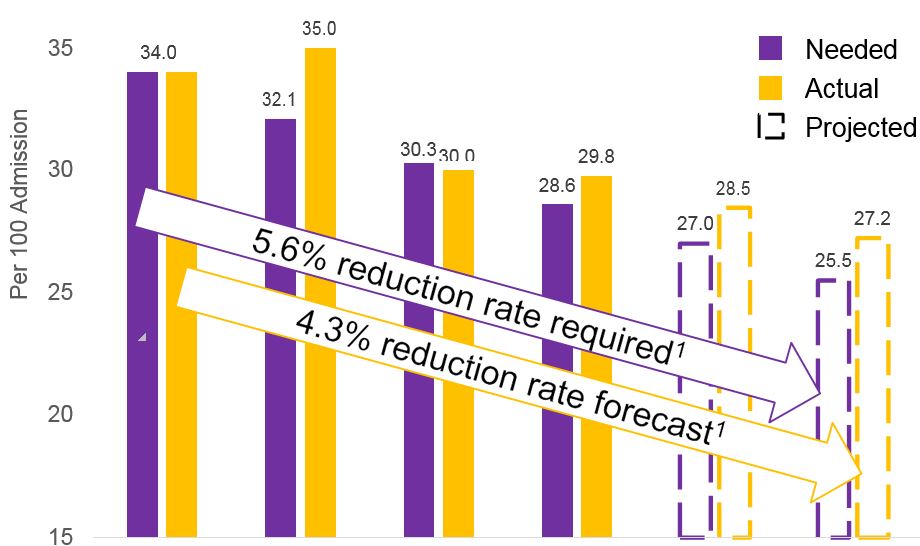
PPV: Current results and performance opportunity
Potentially Preventable Emergency Room Visits
| MY0 | MY1 | MY2 | MY31 | MY4 | MY5 | |
|---|---|---|---|---|---|---|
| Needed | 34.0 | 32.1 | 30.3 | 28.6 | 27.0 | 25.5 |
| Actual | 34.0 | 35.0 | 30.0 | 29.8 | 28.5 | 27.2 |
| Delta | 0.0 | −2.9 | 0.3 | −1.2 | −1.5 | −1.7 |
Pursuing the goal of 25% reduction...
If current rates are maintained, the State will not achieve a 25% reduction over baseline (will end at a 19.9% reduction over baseline).
MY2 CAGR was −6.1%, that rate has been reduced to 4.3% when including MY3 data
| MY31 Rates | PPS |
|---|---|
| < −3% | NCI (−5.45%), NYU Lutheran, SIPPS, NYPQ |
| −2.9% to − 2.0% | SCC, WMCH, Refuah, CPWNY, ACP, NY Presby |
| −1.9% to − 1.0% | OneCity, BPHC, BHA, MCC, Alliance, LCHP, BHNNY, CCB, NQP |
| −1% to 0 | CNYCC, FLPPS, AHI, MHVC, Mt. Sinai, CCN |
___________________________________
Notes:
1. Projection assumes a consistent denominator year over year, and rate estimates are based on CAGR projection driven by MY0 – MY3 non–case mix adjusted results with only three quarters of MY3 data included.
Statewide Accountability Milestones
The STCs identify four measures for which statewide performance is evaluated, beginning in Dy3:
| Statewide Milestone | Pass Criteria |
|---|---|
| 1. Statewide metrics performance | More metrics are improving on a statewide level than are worsening1 |
| 2. Success of projects statewide2 | More metrics achieving an award than not |
| 3. Total Medicaid spending3 | 1) The growth in the total Medicaid spending is at or below the target trend rate (DY4–5 only) and 2) The growth in statewide total IP & ED spending is at or below the target trend rate (DY3–5) |
| 4. Managed care plan | Achieving VBP roadmap goals related to value–based payment transition |
If the state fails any of the four statewide milestones:
| DY 3 | DY 4 | DY 5 | |
|---|---|---|---|
| Penalty | $74.09M (5% of funds) | $131.71M (10% of funds) | $175.62M (20% of funds) |
___________________________________
Notes:
1. Based on previous year and baseline comparisons
2. Based on project-specific and population-wide quality metrics
3. At or below target based on trend rate
Statewide Milestone #1 Summary
Statewide Milestone #1 is a test of the universal set of statewide delivery system improvement measures1 consisting of 18 measures;11 of which have comparable data as of MY3. In MY3, with seven of 11 measures maintaining or improving, the state is on track to pass, as more measures are improving than are worsening.
| Statewide Category | Statewide Measure Name | Status MY1 vs MY2 |
Status MY3 Trend (9 mos) |
MY2 Result | MY3 Performance (9 mos) |
|---|---|---|---|---|---|
| Potentially Avoidable Services |
Potentially Preventable Readmissions (rate per 100,000) | Maintain/Improve | Improving | 577.88 | 567.28 |
| Potentially Preventable Emergency Room Visits (rate per 100) | Maintain/Improve | Improving | 30.26 | 29.76 | |
| PQI – 90 – Composite of All Measures | Maintain/Improve | Improving | 1134.15 | 1108.56 | |
| PDI – 90 – Composite of All Pediatric Measures | Maintain/Improve | Worsening | 254.94 | 274.02 | |
| Access to Care | Children´s Access to Primary Care – 12 to 24 Months | Maintain/Improve | Improving | 94.36 | 94.77 |
| Children´s Access to Primary Care – 25 months to 6 years | Maintain/Improve | Worsening | 92.85 | 92.69 | |
| Adult Access to Preventive or Ambulatory Care – 20 to 44 years | Maintain/Improve | Worsening | 83.14 | 82.35 | |
| Adult Access to Preventive or Ambulatory Care – 45 to 64 years | Maintain/Improve | Worsening | 90.33 | 90.21 | |
| Adult Access to Preventive or Ambulatory Care – 65 and older | Worsen | Improving | 90.07 | 90.16 | |
| Children´s Access to Primary Care – 7 to 11 years | Worsen | Improving | 97.07 | 97.14 | |
| Children´s Access to Primary Care – 12 to 19 years | Worsen | Improving | 95.35 | 95.62 | |
| Primary Care | Primary Care – Usual Source of Care (C&G CAHPS) | Maintain/Improve | N/A | ||
| Primary Care – Length of Relationship (C&G CAHPS) | Worsen | N/A | |||
| Percent of PCP (Primary Care Providers) Meeting PCMH or Advance Primary Care Standards | Worsen | N/A | N/A P4R only | ||
| Timely Access | Getting Timely Appointments, Care and Information (C&G CAHPS) | Worsen | N/A | ||
| Care Transitions | Care Coordination (C&G CAHPS) | Worsen | N/A | ||
| System Integration Meaningful Use Providers |
Percent of Eligible Providers Who Have Participating Agreements with Qualified Entities | N/A | N/A | N/A P4R only | |
| Percent of Eligible Providers Who Are Able to Participate in Bidirectional Exchange | N/A | N/A | N/A P4R only |
1. At the close of DY3, the Independent Assessor will determine whether the state has passed this milestone. The milestone will be passed when more metrics are improving on a statewide level than are worsening, as compared to the prior year as well as compared to initial baseline performance.
N/A: Data collection began in MY1 and/or MY2, and therefore, comparative results not available.
Statewide Milestone #1
For the 11 measures with trendable data, the table below highlights those PPS with MY3 performance trends that are stable or not improving compared to the performance in MY2.
| Statewide Category | Statewide Measure Name | Status MY1 vs MY2 |
Status MY3 Trend (9 mos) |
MY2 Result | MY3 Performance (9 mos) |
|---|---|---|---|---|---|
| Potentially Avoidable Services |
Potentially Preventable Readmissions (rate per 100,000) | Improving | 577.88 | 567.28 | CPWNY, Montefiore, Mount Sinai, Millennium, NYPQ, CCB, Alliance |
| Potentially Preventable Emergency Room Visits (rate per 100) | Improving | 30.26 | 29.76 | Care Compass, Mount Sinai, Montefiore, CCB, Leatherstocking, Alliance, OneCity, NYP | |
| PQI – 90 – Composite of All Measures | Improving | 1134.15 | 1108.56 | Alliance, Montefiore, CCB, AHI, Mount Sinai, Millennium, | |
| PDI – 90 – Composite of All Pediatric Measures | Worsening | 254.94 | 274.02 | Refuah, Brooklyn Bridges, FLPPS, BPHC, OneCity, Leatherstocking, NCI, Millennium, SIPPS, CCB, ACP, Mount Sinai, NYP, CPWNY | |
| Access to Care | Children´s Access to Primary Care – 12 to 24 months | Improving | 94.36 | 94.77 | Care Compass, WMC, SCC, BPHC, Montefiore, FLPPS, Refuah, SIPPS, NCI, BHNNY, Alliance |
| Children´s Access to Primary Care – 25 months to 6 years | Worsening | 92.85 | 92.69 | Alliance, Refuah, Brooklyn Bridges, OneCity, Care Compass, ACP, Montefiore, AHI, BHNNY, SIPPS, BPHC, Mount Sinai, CNYCC | |
| Adult Access to Preventive or Ambulatory Care – 20 to 44 years | Worsening | 83.14 | 82.35 | Leatherstocking, FLPPS, WMC, CNYCC, Alliance, AHI, BHNNY, OneCity, NQP, ACP, CPWNY, BPHC, SIPPS, NYP–Q, CCB, Refuah, BHA, NYP, Care Compass, Brooklyn Bridges, SCC | |
| Adult Access to Preventive or Ambulatory Care – 45 to 64 years | Worsening | 90.33 | 90.21 | CNYCC, BHNNY, CPWNY, NYP, Refuah, Alliance, CCB, WMC, AHI, ACP, BHA, BPHC, NQP, SCC, Care Compass, Brooklyn Bridges, SIPPS | |
| Adult Access to Preventive or Ambulatory Care – 65 and older | Improving | 90.07 | 90.16 | Leatherstocking, CNYCC, FLPPS, BHNNY, ACP, NQP, BPHC, BHA, NYP–Q, SCC, Millennium, NCI, AHI, Refuah | |
| Children´s Access to Primary Care – 7 to 11 years | Improving | 97.07 | 97.14 | AHI, SCC, Care Compass, Brooklyn Bridges, NYP, NQP, BPHC, SIPPS, BHA, WMC | |
| Children´s Access to Primary Care – 12 to 19 years | Improving | 95.35 | 95.62 | SCC, CPWNY, BHNNY, Care Compass, NYP, SIPPS |
1. At the close of DY3, the Independent Assessor will determine whether the state has passed this milestone. The milestone will be passed when more metrics are improving on a statewide level than are worsening, as compared to the prior year as well as compared to initial baseline performance.
N/A: Data collection began in MY1 and/or MY2, and therefore, comparative results not available.
Statewide Milestone #2 Summary
Statewide Milestone #2 is a composite measure of success of projects statewide on project–specific and population–wide quality metrics; the 1st test is based on MY3 performance
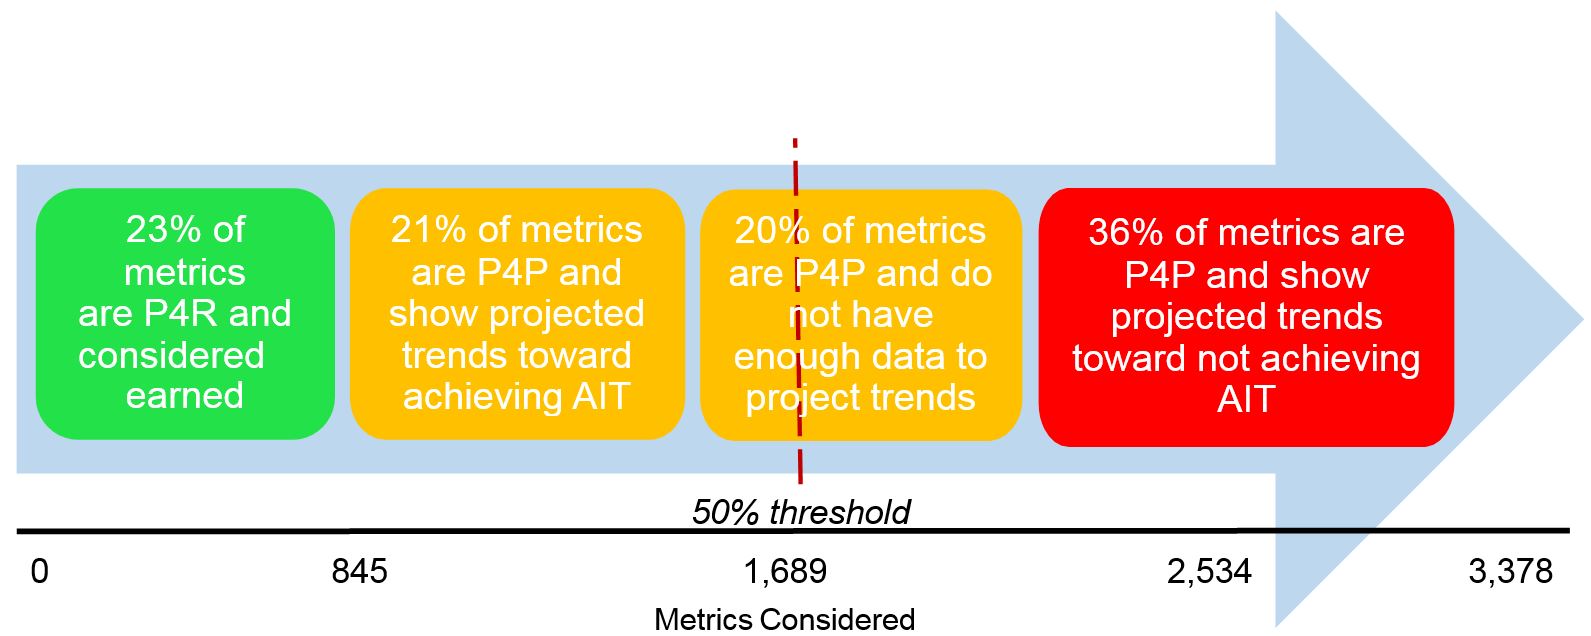
Milestone is passed if over 50% of metrics achieve Annual Improvement Target (AIT/10% gap–to–goal).
Based on current MY3 performance trend, the state is almost on track to meet this milestone
MY3 Preview: Performance for All PPS Measures
| Measure Name | MY3 Month 1 to MY3 Month 9 All PPS Average |
Improving (MY3 Month 1 to MY3 Month 9) |
Meeting AIT (as of MY3 Month 9) | Improving but not Meeting AIT |
Turns P4P in: |
|---|---|---|---|---|---|
| Follow–up care for Children Prescribed ADHD Medications – Initiation Phase | Did not improve | 13/25 | 9/25 | 4/25 | DY4 |
| PQI 90 – Composite of all measures +/− | Did not improve | 15/25 | 8/25 | 7/25 | DY3 |
| Adherence to Antipsychotic Medications for People with Schizophrenia | Did not improve | 13/25 | 6/25 | 7/25 | DY3 |
| PDI 90 – Composite of all measures +/− | Did not improve | 10/25 | 6/25 | 4/25 | DY3 |
| Adult Access to Preventive or Ambulatory Care – 45 to 64 years | Did not improve/stable | 10/25 | 4/25 | 6/25 | DY3 |
| Children´s Access to Primary Care – 25 months to 6 years | Did not improve/stable | 11/25 | 2/25 | 9/25 | DY3 |
| Adult Access to Preventive or Ambulatory Care – 20 to 44 years | Did not improve | 4/25 | 1/25 | 3/25 | DY3 |
| HP Follow–up after hospitalization for Mental Illness – within 7 days | Improved | 22/25 | 18/25 | 4/25 | DY3 |
| HP Follow–up After Hospitalization for Mental Illness – within 30 days | Improved | 20/25 | 15/25 | 5/25 | DY3 |
| HP Cardiovascular Monitoring for People with Cardiovascular Disease and Schizophrenia^ | Improved | 15/25 | 13/25 | 2/25 | DY2 |
| HP Potentially Preventable Emergency Department Visits (for persons w/BH diagnosis) +/− | Improved | 16/25 | 11/25 | 5/25 | DY3 |
| HP Potentially Preventable Readmissions +/− | Improved | 16/25 | 10/25 | 6/25 | DY2 |
| Engagement of Alcohol and Other Drug Dependence Treatment (Initiation & 2 visits within 44 days) | Improved | 13/25 | 10/25 | 3/25 | DY2 |
| HP Antidepressant Medication Management – Effective Continuation Phase Treatment | Improved | 12/25 | 9/25 | 3/25 | DY2 |
| Follow–up care for Children Prescribed ADHD Medications – Continuation Phase^ | Improved | 11/25 | 9/25 | 2/25 | DY4 |
| Children´s Access to Primary Care – 12 to 19 years | Improved | 19/25 | 9/25 | 10/25 | DY2 |
| Adult Access to Preventive or Ambulatory Care – 65 and older^ | Improved | 12/25 | 8/25 | 4/25 | DY2 |
| Children´s Access to Primary Care – 12 to 24 Months | Improved | 16/25 | 8/25 | 8/25 | DY3 |
| Children´s Access to Primary Care – 7 to 11 years | Improved | 16/25 | 6/25 | 10/25 | DY2 |
| Initiation of Alcohol and Other Drug Dependence Treatment (1 visit within 14 days) | Improved | 13/25 | 6/25 | 7/25 | DY2 |
| HP Antidepressant Medication Management – Effective Acute Phase Treatment | Improved | 13/25 | 7/25 | 6/25 | DY2 |
| HP Diabetes Monitoring for People with Diabetes and Schizophrenia^ | Improved | 15/25 | 7/25 | 8/25 | DY2 |
| Diabetes Screening for People w/ Schizophrenia or Bipolar Disease Using Antipsychotic Medication | Improved | 18/25 | 6/25 | 12/25 | DY3 |
| HP Potentially Preventable Emergency Room Visits +/− | Improved | 15/25 | 5/25 | 10/25 | DY3 |
| + A lower rate is desirable ^ Small numbers in the denominators by PPS Bold = statewide measure included in Milestone #1 HP = High Performance measure |
|||||
Statewide Milestone #2
Statewide Milestone #2 is a composite measure of success of projects statewide on project-specific and population-wide quality metrics; the 1st test is based on MY3 performance
The following metrics have been identified as having the greatest influence on the ability of the state to achieve Statewide Milestone #2. For each metric, a cohort of PPS performing within +/- 5% of their AIT have been identified as being most likely to influence success on SWAM #2.
| PPS within +/−5% AIT | ||
|---|---|---|
| SWAM #2 Influential Metrics* | ||
| On track to hit AIT | Not on track to hit AIT | |
| Potentially Preventable Readmissions | Care Compass, CNYCC | FLPPS, BPHC, SCC, NQP, AHI, OneCity |
| Potentially Preventable Emergency Room Visits | NYPQ, BHA, SCC, CNYCC, SIPPS | NQP, ACP, MCC, CPWNY, AHI, WMC, FLPPS, BPHC |
| PQI – 90 | LCHP, NQP, Care Compass, SIPPS | NYPQ, CPWNY, BHA, CNYCC, FLPPS, BPHC,NYP |
| PDI – 90 | Alliance, CNYCC | LCHP, NQP, NYPQ |
| Potentially Preventable Emergency Room Visits (BH Population) | MCC, BHA, WMC, NQP, NYU Lutheran, FLPPS, SCC, BPHC | Care Compass, CPWNY, BHNNY, OneCity, AHI, ACP |
| Adherence to Antipsychotic Medications for People w/Schizophrenia | WMC, Refuah, BPHC, OneCity, CNYCC | NQP, SCC, NYP, ACP, LCHP, MHVC, MCC, Mount Sinai, BHA, CCB |
| Diabetes Screening: People w/Schizophrenia or Bipolar Disorder Using Antipsychotic Medication | LCHP, NYU Lutheran, CCB, NQP, BPHC, ACP, BHA, SIPPS, CPWNY, Care Compass | NYPQ, NYP, WMC, Alliance, AHI, FLPPS, NCI, Refuah, OneCity, Mount Sinai, MHVC, MCC, SCC, CNYCC, |
| * The SWAM #2 Influential Metrics list does not include the Children´s or Adult Access measures nor does the list include any of the non-claims based measures. | ||
Measures that show much more progress in MY3 compared to MY2
| Measure Name | MY2 Performance | MY3 Month 1 to MY3 Month 9 # PPSs that are improving |
MY3 M9 # PPS already meeting MY3 AIT |
Turns P4P in: |
|---|---|---|---|---|
| HP Follow–up after hospitalization for Mental Illness – within 7 days | 3/25 | 22/25 | 18/25 | DY3 |
| HP Follow–up After Hospitalization for Mental Illness – within 30 days | 5/25 | 20/25 | 15/25 | DY3 |
| Initiation of Alcohol and Other Drug Dependence Treatment (1 visit within 14 days) | 1/25 | 13/25 | 6/25 | DY2 |
| Engagement of Alcohol and Other Drug Dependence Treatment (Initiation & 2 visits within 44 days) | 3/25 | 13/25 | 10/25 | DY2 |
| HP Antidepressant Medication Management – Effective Continuation Phase Treatment | 1/25 | 12/25 | 9/25 | DY2 |
| HP Antidepressant Medication Management – Effective Acute Phase Treatment | 1/25 | 13/25 | 7/25 | DY2 |
| HP: High Performance measure ^ The denominator for this measure is less than 30 for some Performing Provider System´s, therefore the rates may not be stable due to small numbers. § MY2 measure results should not be compared to measure results for prior years due to the use of ICD–10 diagnosis codes. |
||||
MY3, Month 9 – Warning Lights

✓ Statewide PPR rate trending to hit 25% reduction target
! But...trend rate has slowed from MY2 which could put target at risk
! Statewide PPV rate is not on path to hit 25% reduction target
! SWAM #2 is not projected to pass
Attention to PPV, PPR, PDI 90, PQI 90 and all Adult and Child Access measures needed to support passing both SWAM #1 and #2
MY3, Month 9 – Highlights
✓ 17 of 24 all–PPS measures (with monthly data) improved
✓ 7 of 7 High Performance measures (with monthly data) improved
✓ BH and SUD Measures with very few PPS hitting AIT in MY2 now have several PPS trending to hit AIT in MY3
✓ SWAM #1 is on track to pass with 8 of 11 metrics within 1 point (+/-) of the MY 2 results, leaving a small margin for error but great opportunity to influence the final result
|top of page|Up Next...
- MAPP Updates: Addition of Patient Alerts and the Pharmacy Claims File
Chip Barnes, NYSTEC - Data Sharing and Data Security Update
Alison Pingelski, OHIP, Division of Operations and Systems - PPS and MCO Data Sharing in Action
Christine Blidy, Millennium Collaborative Care - Q and A

Follow Us