Using the Environmental Facilities and Cancer Map
Table of Contents
- Accessing the Map
- General Instructions, Application Controls and Features
- Table of Contents
- Viewing and Displaying Layers and Data
- Printing Maps and Information Windows
Accessing the Map
From the Environmental Facilities and Cancer Mapping home page:
- Scroll down to section View the Map and click the link View the Environmental Facilities and Cancer Map
General Instructions, Application Controls and Features
The map may take time to load. Please be patient.
Use the controls and features shown in Figure 1 in the Environmental Facilities and Cancer Mapping application to navigate.
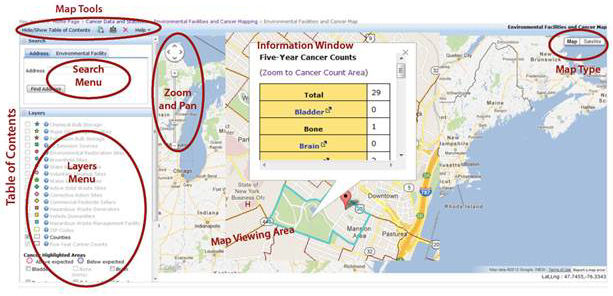
Figure 1. Environmental Facilities and Cancer Mapping Application Controls and Features
Note
Do not use the "Back" button in your Web browser when using the map. Using the "Back" button will take you away from the map and return you to the last Web page you viewed.
Map Tools
Use the Map Tools above the Table of Contents to navigate and use the map (Figure 1).
Hide/Show Table of Contents 
Use this button to enlarge the map viewing area by hiding the Search and Layer Menus. Click Hide/Show Table of Contents again to restore the menu bar.
Full Extent Button 
Use this button to zoom out to the default view which shows all counties in New York State.
Distance Tool 
Use this tool to measure the distance between two points on the map. Click the tool, click on a start location, then double click on an end location on the map. The distance results will display on the bottom left below the map.
Clear Map 
Click this button to remove any layer selections, information windows or features added to the map.
Help 
Use the Help drop down list to view files to learn more About Cancers, About Data, and About Environmental Facilities. You can also find a file with Frequently Asked Questions and instructions on Using the Map.
Table of Contents
Use the Table of Contents (left side of screen) to turn on/off data displays and geographic areas of interest.
Search Menu
Use the Search menu to locate an address or an environmental facility.
Search for an Address
Make sure that the Address tab is selected. Use the Address bar to type in address information, then click the Find Address button or press the Enter key on your keyboard. Provide as complete an address as possible, including street number and name, city, and ZIP Code. This will increase the likelihood that the address will be found.
The map will display a pin identifying the location of the address.
Search for an Environmental Facility
Select the Environmental Facility tab and type in a facility name or ZIP Code to find facilities. Provide the complete name of the facility if possible. This will increase the likelihood that the facility will be found.
The map will display a pin identifying the location of the facility.
Layers Menu
Use the Layers Menu to turn on and add layers to view on the map.
Note
Most layers will be grayed out (deactivated) until you zoom in to an appropriate level to view them on the map.
Zoom Function
There are three options for zooming.
- If your mouse has a scroll wheel, you can scroll the wheel forward to zoom in or backward to zoom out when your mouse cursor is over the map.
- You can use the zoom control at the left side of the map to zoom in or out. Click the plus (+) button or move the slider up to zoom in. Click the minus (-) button or move the slider down to zoom out.
- With your mouse cursor inside of the map display, hold down the shift key and while holding down the left button on your mouse, draw a box around the area you would like to zoom to. After you let go of the shift key and mouse button, the map will zoom in to your area of interest.
Pan (Move) the Map
There are two ways to pan the map.
- You can click and drag the map in the direction you want to move it.
- You can click one of the arrow buttons in the upper left corner of the map to move the map in the direction of the arrow.
Change the Map Type
Click the Map or Satellite buttons in the upper right corner of the map to change from map (default) to satellite imagery. The satellite view might be helpful if you are trying to identify environmental facilities by their physical features.
Viewing and Displaying Layers and Data
Environmental Facilities
To view information about environmental facilities, you first need to display the locations of the types of facilities (e.g., petroleum bulk storage sites, hazardous waste management sites) in which you are interested.
Displaying Locations of Environmental Facilities
- In the Layers Menu on the left side of the screen, check the box next to each type of facility that you would like to display. If the facility type and check box is grayed out, you will need to zoom in before you are able to check the box and view those facility locations.
- For each facility type that you turn on, symbols associated with the facility type in the Layers Menu (such as a blue star for chemical bulk storage sites) will appear on the map where the facilities of that type are located. Some areas of the state may not contain facilities.
Note
If there are two or more facilities in the same location or very close together, the symbols for each may not all be visible at the same time. Zooming in may help differentiate facilities that are quite close to one another. Also, if you click on the facility, any other facility that is hidden will display in the resulting information window.
Viewing Environmental Facility Data
- Find the symbol representing the facility in which you are interested on the map. Hover the mouse cursor over the symbol and click the left mouse button. An information window will appear. If you click where multiple symbols overlap, only the information about the facility represented by the topmost symbol will be displayed, but other facilities can be accessed by using the "Next" link at the top of the information window.
- If the symbol that overlaps it is for a different type of facility, you could hide that facility type by unchecking its check box in the Layers Menu.
About the Environmental Facilities Data
- You can view a summary of a type of environmental facility, including definitions and contact information, by clicking on the question mark symbol next to the facility type label on the Layers Menu.
Counties and ZIP Codes
- Zoom in to activate these data layers. When the layer is activated it will turn from grey to black in the Layers Menu. The Counties data layer is activated by default in the application.
- Check the boxes to display Counties and/or ZIP Codes and uncheck them to remove them from the map.
Five-Year Cancer Counts
- Zoom in to activate the data layer. When the layer is activated it will turn from grey to black. This data layer is checked by default.
- Once the label turns black, the dark red boundaries of the small geographic areas will appear on the map. Users may hide these boundaries by unchecking the Five-Year Cancer Count box on the Layers Menu.
Viewing Five-Year Cancer Counts Data
- Find the small geographic area in which you are interested on the map.
- Hover the mouse cursor inside the area and click the left mouse button. An Information Box showing the counts of the different types of cancers diagnosed in that area will appear. You can learn more about different types of cancers by clicking the hyperlink labels for each cancer.
- You can zoom in closely on the cancer count area by clicking on the 10-digit Small area ID number link at the top of the table.
Note
Cancer counts can only be viewed for individual small geographic areas. Small geographic areas cannot be combined on the map.
About the Five-Year Cancer Counts Data
You can view detailed information about the five-year cancer counts data by clicking on the question mark symbol next to the Five-Year Cancer Counts label on the Layers Menu and by clicking the About Data link on the Help Menu.
Viewing Cancer Highlighted Areas
- Check the box next to the cancer type you are interested in viewing. Cancers for which there are no highlighted areas are listed separately.
- An Information Box titled About Cancer Risk will appear each time a unique cancer type is selected to view. After reading the messages, close the Information Box by clicking the small x in the upper right corner.
- Highlighted areas will appear as pink and blue circles on the map indicating areas where that cancer is above (pink) or below (blue) what would be expected.
- Zoom in on the areas using the Map Zoom feature if desired.
Viewing Cancer Highlighted Areas data
- Find the pink or blue geographic area in which you are interested on the map.
- Hover the mouse cursor inside the highlighted area and click the left mouse button. An Information Box showing the five-year observed and expected cancer statistics and the population will appear along with five-year cumulative rates for that cancer in the highlighted area and in New York State. A bar graph will also be displayed showing the rate of that cancer in New York State compared to other chronic diseases. You can learn more about the cancer statistics by clicking the About the Data link at the bottom of the Information Box.
- Zoom in on the area by clicking the Zoom to Highlighted Area link at the top of the Information Box.
Multiple Layers
You can view multiple data layers, except for multiple highlighted areas, in the application. Check the box of the layers that you wish to display on the Layers Menu and those selections will appear on the map.
Viewing Data for Multiple Layers
- Find the symbol (e.g. five-year cancer count area, environmental facility symbol, or pink or blue highlighted area) in which you are interested in viewing on the map.
- Hover the mouse cursor on the symbol and click the left mouse button.
- An Information Box will appear with associated data, and above the title you will see links to more data and navigation aids to view Information Boxes associated with other map layers e.g. Prev 1 of 2 Next.
- Click Prev or Next to move between data layers.
Note
Five-year Cancer Counts and Cancer Highlighted Areas are shown in a teal colored outline on the map when identified. If multiple layers are identified there will be a "Prev" and a "Next" link displayed at the top of the information window. When you click on one of these links, information for another layer will be displayed, and that layer will be identified on the map by displaying a teal outline identifying the boundaries of the Five-Year Cancer Count or Highlighted areas.
Printing Maps and Information Windows
There is no print function built into the maps. Screen shots from the application can be captured, sent to another application (e.g. word processing application) and printed from that application by following these steps.
- Maximize your browser window
- Press the "Alt" and "Print Scrn" keys on your keyboard at the same time to copy the browser window.
- Open a new file in another application.
- Select Paste from file menu.
- Use the print function in that application to print the information.
