Community Care Connections
- Report is also available in Portable Document Format (PDF)
Lifespan of Greater Rochester Inc.
FINAL REPORT
New York State Department of Health Contract # C030146
Lifespan of Greater Rochester Inc.1900 S. Clinton Avenue
Rochester, NY 14618
Ann Marie Cook, president/CEO
585-244-8400
www.lifespanrochester.org
PROJECT NAME: Community Care Connections
CONTRACTOR SFS PAYEE NAME: Lifespan of Greater Rochester Inc.
CONTRACT #: C030146
COST EXTENSION: August 1, 2018 – December 31, 2019
________________________________________________________________________________
FINAL REPORT
Executive Summary
Community Care Connections (CCC) began as a three-year pilot (2015-2018) with funding from the New York State Department of Health (NYS DOH). Our strategic vision for the initial CCC pilot was to prove that integrating traditional community-based aging services with medical systems of care positively affects the triple aim of cost, quality and patient satisfaction. We sought to change the paradigm by breaking down the silos between community-based aging services and medical systems of care to help an increasing population of older adults access the right care, at the right time, at the right place. A report detailing the successful CCC pilot intervention results was submitted by Lifespan previously after the end of the initial pilot (7/31/2018).
With the support of NYS DOH following the pilot project through a cost extension, Lifespan has been able to continue the CCC implementation and subsequent ongoing evaluation of the intervention by the New York Academy of Medicine (NYAM) in partnership with the Rochester Regional Health Information Organization (RHIO). With funding from the Robert Wood Johnson Foundation (RWJF), NYAM also completed a control group evaluation.
Preliminary results from the control group analysis are available and are summarized in this report.
Project Goal: Evaluate and inform effective approaches to integrating community-based aging services with medical systems of care.
Projected Project Outcomes:
- Provide a replicable, effective integration model for New York State (NYS).
- Increase knowledge of which social services make the most difference for patients/caregivers.
- Utilize previous and ongoing return on investment data analysis to further develop and deliver value proposition presentations to potential payers to obtain sustained funding.
- Improve access to supportive services for unmet ADL/IADL needs.
- Reduce unnecessary hospital readmissions.
- Reduce unnecessary emergency department (ED) visits.
- Reduce caregiver strain/burden.
- Improve patient/caregiver satisfaction with a focus on meeting patient/caregiver goal(s).
Evaluation
The New York Academy of Medicine was the principal evaluator with data from Lifespan and the Rochester RHIO.
Evaluation Results
As evaluated by the NY Academy of Medicine, the Community Care Connections service resulted in:
- Decreased hospitalizations.
- Decreased ED visits.
- Decreased observation stays.
- CCC patients experienced a greater decrease in their health care utilization rate (hospitalizations, ED visits, observation stays) than patients in a matched-control group (preliminary findings, subject to change).
Community Care Connections Methodology
- Referrals from health care access points including:
- Sixty-five physician practices in Monroe, Ontario and Livingston counties with embedded social workers.
- Home care agencies (Lifetime Care, University of Rochester Medicine Home Care and HCR Home Care).
Patient Inclusion Criteria
- 55 or older.
- Struggled with medical adherence.
- Co-morbidities – especially those with limited Activities of Daily Living (ADL) capabilities.
- Hospitalization and/or ED visit at least once in the previous year.
- Low health literacy.
- Low-income, communities of color experiencing high health disparities.
- Housing and financial instability.
- An aging or stressed caregiver.
- Without family and/or caregiver support.
- With substance abuse and mental health issues.
Intervention Components
- In-home Social Workers.
- Healthcare Coordinators (patient advocates and educators).
Number Served
- The number of patients served during the initial pilot through June 30, 2018 was 1,667.
- The total number of patients served from the start of the program through 12/31/2019 was 2,397.
Lifespan of Greater Rochester Inc.
Community Care Connections Cost Extension
FINAL REPORT
New York State Department of Health Contract # C030146
With support from the New York State Department of Health, Lifespan created Community Care Connections because of an acute need for an integrated care approach for older adults. In this report, we conclude that Community Care Connections has successfully integrated with healthcare access points to break down the silos between community-based aging services and medical systems of care. In doing so, Lifespan of Greater Rochester created a replicable model of integrated care for older adults for New York State. From August 1, 2015 through the last quarter of 2019, Community Care Connections assisted 2,397 older adults who were referred by medical systems of care.
Lifespan of Greater Rochester helps older adults and caregivers take on the challenges and opportunities of longer lives. Lifespan is a trusted source of unbiased information, guidance and more than 30 services and advocacy for over 40,000 people in the Greater Rochester and Finger Lakes region annually, including older adults, people with disabilities, and caregivers. Lifespan provides care management, elder abuse prevention, Alzheimer´s care navigation, ombudsman and financial management services. Lifespan works with all health systems, payers and other non-profits to link older adults to the services that best meet the person´s needs.
Lifespan´s mission as a community-based organization is in alignment with New York State´s objective to transform the healthcare delivery system, improve clinical outcomes, decrease unnecessary hospital use, increase patient and medical provider satisfaction. With a wealth of knowledge, expertise and experience in supporting medically frail, low income, vulnerable older adults with low health literacy, Lifespan is uniquely positioned to positively impact the health outcomes of this high healthcare utilizing population by addressing the social determinants that physicians´ offices do not have the time or resources to manage.
Background
Strategic Goal: Prove that integrating traditional community-based aging services with medical systems of care positively affects the triple aim of cost, quality and patient satisfaction.
Project Goal: Evaluate and inform effective approaches to integrating community-based aging services with medical systems of care.
Demonstration Project Goal: Evaluate and inform effective approaches to integrating community-based aging services with medical systems of care.
Project Outcomes:
- Provide a replicable, effective integration model for New York State (NYS).
- Increase knowledge of which social services make the most difference for patients/caregivers.
- Utilize previous and ongoing return on investment data analysis to further develop and deliver value proposition presentations to potential payers to obtain sustained funding.
Patient/Caregiver Outcomes:
- Improve access to supportive services for unmet Activities of Daily Living needs.
- Reduce unnecessary hospital readmissions.
- Reduce unnecessary emergency department (ED) visits.
- Reduce caregiver strain/burden.
- Improve patient/caregiver satisfaction with a focus on meeting patient/caregiver goal(s).
Project service area: Monroe, Wayne, Ontario, Livingston Counties.
Targetpatients:55+, all payers, including limited English-speaking patients. The project collected data on diagnosis, hospitalizations, ED use, race, ethnicity, socioeconomic status, and gender.
Community Care Connections Methodology
We use care access points to break down the traditional barriers and silos between community-based aging services and medical systems of care to help an increasing population of older adults´ access to Activity of Daily Living (ADL/IADL) supportive services, reduce hospital admissions/readmissions and ED visits, and reduce caregiver burden.
Care Access Points Used:
- Physician practices willing to include a co-located Lifespan social work care manager in their case management workflow.
- "Non-contracted" physician practices without co-located social workers.
- Home Health Care Agencies.
Community Care Connections uses a team approach that includes social workers as care navigators, LPN healthcare coordinators and a community healthcare worker. Each patient referred is assessed via the Geriatric Wellness Screen (GWS) developed in partnership with the University of Rochester. The GWS is a tool for gathering information about patients´ health and social determinants of health. Each domain in the GWS results in an Older Americans Resources and Services (OARS) score which informs the development of a personal care plan to address health and social needs. Patients can be connected to evidence-based chronic disease and fall prevention classes, post-hospitalization home meal delivery and light housekeeping, minor home modifications and transportation.
Intervention Components:
- Social Work Care Managers conduct home visits, assessment, care planning and link patients to community-based services such as housing, caregiver supports and financial benefits.
- LPN Healthcare Coordinators and Community Health Workers (patient advocates and educators), schedule and attend appointments with the patient, coordinate transportation, ensure access to preventative health screens, conduct medication reconciliations, and provide health literacy training.
- A combination of the above interventions.
Evaluation and Results
This updated report documents the continued success of the CCC through two different studies:
Study (1) (pages 7–12)
The ongoing analysis by New York Academy of Medicine (NYAM) for patients served from June 10, 2016 through December 31, 2019. Following the initial pilot analysis completed for patients served through June 30, 2018, New York Academy of Medicine continued to analyze the change in emergency room and hospitalization utilization and estimated return on investment for those who gave consent for data sharing.
Study (2) (pages 12–17)
A Robert Wood Johnson Foundation (RWJF) Systems for Action study titled, "Integrating Health and Social Services for Older Adults: The Case of the Community Care Connections Program." The study included a comparison of a matched control group and the CCC patients enrolled between 6/1/2016 and 7/1/2018.
Study (1)
Ongoing analysis by New York Academy of Medicine (NYAM) for patients served from June 10, 2016 through December 31, 2019. (pages 7–12)
We contracted with the New York Academy of Medicine to evaluate the effectiveness and return on investment of the interventions.
We contracted with the Rochester Regional Health Information Organization (RRHIO) to provide emergency room and hospitalization encounter data for pre- and post-intervention comparisons.
Data flow and analysis
The Rochester Regional Health Information Organization (RRHIO), Lifespan, and evaluator, New York Academy of Medicine (NYAM), worked as a team to facilitate data analysis. Peer Place data extracts were sent to the RRHIO. They isolated the patients with IRB consent and added dates of ED visits, observations and hospitalizations occurring one year prior to and one year after enrollment in Community Care Connections. The RRHIO de-identified the data and sent the file to NYAM for analysis.
A total of 2,397 patients were served from June 10, 2016 through December 31, 2019. Of the total served, 1,467 patients provided consent for data sharing between June 10, 2016 and September 1, 2019.
Evaluation Conclusion
Return on Investment (ROI): As evaluated by the New York Academy of Medicine, the return on investment is $3.42 per dollar spent on the service based on an analysis of 90 day pre- and post-data.
- Hospitalizations decreased 22%.
- ED visits decreased 30%.
- Observation stays decreased 22%.
NYAM REPORT, ONGOING ANALYSIS:
THE NEW YORK ACADEMY OF MEDICINE | HEALTHY CITIES, BETTER LIVES
The following analyses are based on data provided from the Rochester Regional Health Information Organization (RRHIO) and Lifespan and presents information on changes in hospitalizations and emergency department visits among Community Care Connections (CCC) patients.
Because the analysis is ongoing, NYAM notes that the reported results are preliminary and subject to change.
Through September 1, 2019, Community Care Connections served 2,397 patients.
1,467 patients signed Institutional Review Board informed consent for data analysis.
Patient Demographics:
Female (62%)
White (78%)
Low-income (less than $1000/mo.) (41%)
Lives alone (44%)
Lives with a spouse or others (48%)
Two or more chronic health conditions (80%)
Medicare only beneficiary (68%)
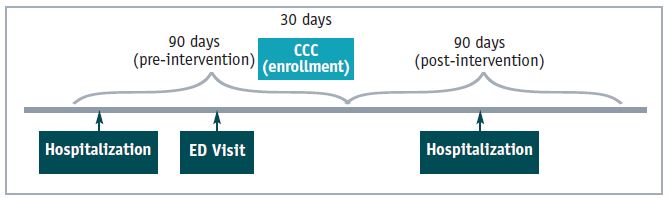
Patients participated in CCC an average of 156 days and were connected to an average of three services (2.83). At the time of this report, complete data (90 days pre/post) was available for 1,467 patients who enrolled prior to September 1, 2019.
The 90-day pre- and post-analysis provided the largest sample number and aligns with the average four-month length of service in the project.
NOTE: Return on investment (ROI) calculations assume that the program serves 1,000 patients at a cost of $610,000 annually.
Appendices 1 through 8 are provided by NYAM for Study (1) at the end of this report.
Quantitative Results:
Average number of hospitalizations, emergency department visits, and observations per client decreases after 90 days of CCC program participation.
| % of CCC Patients (N) | Pre-CCC | Post-CCC | % Change | |
|---|---|---|---|---|
| Hospitalizations | 1,467 | 0.109 | 0.085 | −22% |
| ED Visits | 1,467 | 0.393 | 0.272 | −30%* |
| Observations | 1,467 | 0.162 | 0.127 | −22%* |
Significant at p < .05
A measurement of the 90 day pre- and post-effect of the intervention analyzed by diagnoses shows the following top five impacted health conditions:
Decreased Hospitalizations
| Condition | % Change |
|---|---|
| Heart Failure | −29% |
| Stroke | −22% |
| Hypertension | −20% |
| Heart Disease | −18% |
| COPD | −15% |
Decreased Emergency Room Visits
| Condition | % Change |
|---|---|
| Heart Failure | −44%* |
| Hypertension | −31%* |
| Depression | −29%* |
| COPD | −37%* |
| Diabetes | −23%* |
Significant at p < .05
A measurement of the 90-day pre- and post-effect of the intervention analyzed by service connection shows the following top eight impactful services:
Decreased Hospitalizations and Emergency Room Visits
| Service | Hospitalizations | ED Visits | Observations |
|---|---|---|---|
| Financial Benefits Counseling | −47%* | −41%* | −8% |
| Transportation | 33% | 26%* | −26% |
| Home Health Aid/Personal Care | −17% | −39%* | −21% |
| Medicaid | −9% | −5% | −47%* |
| Home Modification | 57% | −47%* | −31% |
| Health Insurance Counseling | −55%* | −30% | −20% |
| Medical Provider Specialist | −54%* | −26% | −23% |
| Housekeeping | −64%* | −47%* | −21% |
Significant at p < .05
90-day Pre/Post Analysis:
Percent Change in Health Care Utilization by # of diagnosis categories
| # of Health Condition Types |
% Change (Hospital) |
% Change ED |
% Change Observations |
|---|---|---|---|
| 1 | −46% | −49%* | 26% |
| 2 | 0% | −43%* | −19% |
| 3 | −27% | −11% | −31% |
| 4 | 25% | −14% | −35% |
| 5 or more | 10% | −35%* | −47%* |
Return On Investment (ROI) 90 Day Pre/Post Analysis
Every dollar spent on the CCC program is associated with an estimated $3.42 in reduced costs related to hospitalization, ED visits and observations (using a 90-day analysis).
| Pre-CCC | Post-CCC | ||
|---|---|---|---|
| Number of patients | 1467 | ||
| Average number per client | |||
| Hospitalizations | 0.436 | 0.340 | |
| ED Visits | 1.572 | 1.088 | |
| Observations | 0.648 | 0.508 | |
| Admission cost per patient ($) | |||
| Hospitalizations | 13,964 | ||
| ED Visits | 937 | ||
| Observations | 2,091 | ||
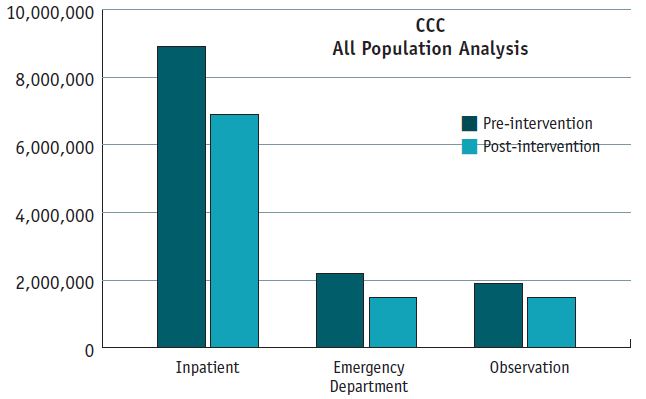
| Total health care costs* ($) | |||
| Hospitalizations | 8,931,664 | 6,965,059 | |
| ED Visits | 2,161,870 | 1,496,256 | |
| Observations | 1,988,085 | 1,558,561 | |
| Total CCC program costs ($) | |||
| Per Client | 610 | ||
| Total | 894,870 | ||
| Total Savings ($) | |||
| Hospitalizations | 1,966,605 | ||
| ED Visits | 665,614 | ||
| Observations | 429,525 | ||
| ROI | 242% |
ROI calculations rely on several assumptions, all of which impact the final ROI estimate.
- Complete data is available for 1,467 clients. This is the number of clients who enrolled in CCC before September 1, 2019 who provided consent for data sharing.
- These analyses assume that the CCC program serves 1,000 clients and costs $610,000 per year. Average costs for hospitalizations and ED visits were calculated using data from the 2017 Medical Expenditure Panel. Average cost for an observation was extrapolated from a 2013 US Surgeon General report using data from the Health Care Cost and Utilization Project (Department of Health and Human Services, 2013).
*All costs were adjusted to 2019 dollars using the Consumer Price Index for Medical Services for all Urban Consumers. - Follow up data was only available for 90 days, but program costs and ROI are calculated annually. This ROI calculation assumes that the impact of the program is maintained for the entire year; thus, the average rate of hospitalizations presented in the 90-day pre/post analysis is multiplied by 4 to obtain the estimated average rate of utilization for hospitalizations, ED visits and observation stays.
- Healthcare costs are estimated by multiplying the average cost of an encounter (hospital/ED/observation) by the estimated average cost of such an encounter. Pre/post cost differences are calculated by subtracting the estimated costs in the post-period from the estimated costs in the pre-period.
* Hospitals´ Use of Observation Stays and Short Inpatient Stays for Medicare Beneficiaries
Study (2)
Robert Wood Johnson Foundation (RWJF) Systems for Action control group evaluation titled, "Integrating Health and Social Services for Older Adults: The Case of the Community Care Connections Program." (6/1/2016 – 7/1/2018) (pages 12–17)

Preliminary Control Group Results
CCC patients enrolled between 6/1/2016 and 7/1/2018 experienced a greater decrease in their health care utilization rate (hospitalizations, ED visits, observation stays) than patients in a matched-control group (preliminary findings, subject to change).
1,004 CCC members with complete data were matched to 1,004 Rochester RHIO patients selected from 560,980 potential before/after quarter matches.
Evaluation Conclusions:
- Hospitalizations decreased by an average of 39.6 % per person for CCC patients compared to an average increase of 35% for patients in the control group.
- Emergency department visits decreased by an average of 33.2% per person for program participants. Emergency department visits decreased by an average of 30.9% for people in the control group.
Research Team:
New York University
- José A. Pagán
- Kelley Akiya
The New York Academy of Medicine
- Elisa Fisher
Icahn School of Medicine at Mount Sinai
- Yan Li
Program and Technical Leads:
Lifespan
- Annie Wells
- Christine Peck
Rochester RHIO
- Wendy Beehner
- Andrea Richardson
Methods
We conducted one-to-one propensity score matching between CCC participants and Rochester RHIO patients to be able to compare hospitalizations and emergency department visits 90 days before and 90 days after program participation. We selected 90 days before and after program participation because this timeframe covers the time period in which most CCC participants actively received services.
We conducted the analyses in several steps. The Rochester RHIO grouped Lifespan cohort members participating in the CCC program by each permutation of gender, race, ethnicity, and county (e.g., male + white + Hispanic + Monroe County resident). The date of birth used in the control group data included Rochester RHIO patients in each grouping who were plus or minus two years of the oldest and youngest Lifespan cohort member. Potential control group members were identified by querying for patients whose demographic matched each control grouping within the Rochester RHIO data aggregation tool. Although the control group data were available at the patient level, outcomes on hospitalizations and emergency department visits were provided by the Rochester RHIO aggregated by quarter.
Our Rochester RHIO control group data covered the time period from the third quarter of 2016 to the fourth quarter of 2018. That is, we had 10 quarters of data for each Rochester RHIO patient which means that each patient could potentially contribute nine before/after control group periods. Each CCC participant was coded as belonging to the before/after quarters that best overlaps the Rochester RHIO quarters. For example, a CCC participant that began receiving services on February 3, 2017 could be potentially matched with RHIO patients receiving services during the last quarter of 2016 and the first quarter of 2017 (the pre- and post-program periods, respectively). Although the pre- and post-program time periods do not perfectly overlap, on average they would closely overlap so that no systematic differences should exist.
We had 1,004 CCC members with complete data that we could match to 1,004 Rochester RHIO patients selected from 560,980 potential before/after quarter matches. These potential before/after quarter matches cover the time period ranging from the third quarter of 2016 to the fourth quarter of 2018.
Results
Table 1 reports the average number of hospitalizations per client for the CCC clients and the Rochester RHIO patients serving as controls (intervention and control groups). Hospitalizations decreased by an average of .040 per person for CCC clients compared to an average increase of .027 for patients in the control group.
Table 1. Average Number of Hospitalizations per Client
| 90 Days Before Program Start |
90 Days After Program Start |
Mean Chang | % Change | p-value | |
|---|---|---|---|---|---|
| Intervention Group | 0.101 | 0.061 | −0.040 | −39.6% | |
| Control Group | 0.077 | 0.104 | 0.027 | 35% | 0.008 |
Table 2 reports the average number of emergency department visits per client for intervention and control groups. Emergency department visits decreased by an average of .131 per person for program participants. Emergency department visits decreased by an average of .013 for people in the control group.
Table 2. Average Number of Emergency Department Visits per Client
| 90 Days Before Program Start |
90 Days After Program Start |
Mean Chang | % Change | p-value | |
|---|---|---|---|---|---|
| Intervention Group | 0.394 | 0.263 | −0.131 | −33.2% | |
| Control Group | 0.042 | 0.029 | −0.013 | −30.9% | <.001 |
Table 3 reports the average number of hospitalizations by health condition for the intervention and control groups. We selected three health conditions that are not only highly prevalent among CCC program participants but also costly to Medicare and other payers (hypertension, diabetes, and high cholesterol). Although the average number of hospitalizations falls for patients with hypertension and diabetes, the results are not statistically significant at p<.05. Still, the results are promising in that they show declines in hospitalizations before and after program participation for both hypertension and diabetes, even if the sample sizes for subgroup analyses are relatively small.
Table 3. Average Rate of Hospitalizations by Health Condition
| 90 Days Before Program Start |
90 Days After Program Start |
Mean Chang | % Change | p-value | |
|---|---|---|---|---|---|
| Hypertension (N=423) | |||||
| Intervention Group | 0.059 | 0.047 | −0.012 | −20.3% | |
| Comparison Group | 0.087 | 0.113 | 0.026 | 29.9% | 0.265 |
| Diabetes (N=276) | |||||
| Intervention Group | 0.091 | 0.065 | −0.025 | −27.5% | |
| Comparison Group | 0.112 | 0.091 | −0.022 | −19.6% | 0.939 |
| High Cholesterol (N=211) | |||||
| Intervention Group | 0.062 | 0.066 | 0.005 | 8.1% | 0.150 |
| Comparison Group | 0.071 | 0.147 | 0.076 | 107.0% | |
Table 4 reports the average number of emergency department visits by health condition for the intervention and control groups. Again, we selected three health conditions that are not only highly prevalent among CCC program participants but also costly to Medicare and other payers (hypertension, diabetes, and high cholesterol). Emergency department visits fall for the three health conditions, particularly for hypertension (-.156 in the intervention group compared to -.009 in the control group). The difference in the reduction in emergency department visits between the intervention and control groups is statistically significant at p<.05 for hypertension but not for diabetes and high cholesterol. Just like with hospitalizations, these results are promising in that they show declines in emergency department visits before and after program participation for the three health conditions, even if the sample sizes for subgroup analyses are relatively small.
Table 4. Average Rate of Emergency Department Visits by Health Condition
| 90 Days Before Program Start | 90 Days After Program Start | Mean Chang | % Change | p-value | |
|---|---|---|---|---|---|
| Hypertension (N=423) | |||||
| Intervention Group | 0.374 | 0.217 | −0.156 | −41.7% | |
| Comparison Group | 0.047 | 0.038 | −0.009 | −19.1% | <.001 |
| Diabetes (N=276) | |||||
| Intervention Group | 0.409 | 0.315 | −0.094 | −23.0% | |
| Comparison Group | 0.065 | 0.043 | −0.022 | −33.8% | 0.221 |
| High Cholesterol (N=211) | |||||
| Intervention Group | 0.365 | 0.246 | −0.118 | −32.3% | 0.117 |
| Comparison Group | 0.057 | 0.024 | −0.033 | −57.9% | |
The research teams at the New York Academy of Medicine and New York University are continuing to analyze the data to address some challenges that largely affect emergency department data. More specifically, unlike for hospitalizations, the average rate of emergency department visits is very low for RHIO patients in the comparison group compared to CCC program participants in the intervention group during the pre-program participation period. We are exploring different ways of capturing the acuity of cases so that we can better match CCC program participants with the pool of patients available in the Rochester RHIO data (e.g., including observed patterns in both hospitalizations and emergency department visits during the pre-program participation period as matching variables such as different categorical variables, counts, and interactions). We will provide updated and final results as part of a manuscript being prepared for submission to a peer-reviewed journal.
Qualitative Results:
New York Academy of Medicine conducted interviews of medical professionals and patients about their experiences with CCC, reported anonymously.
The following is a sample of quotes:
Medical Providers / From Interviews Conducted by NYAM:
Providers report that they have more time to focus on providing medical care, instead of trying to address social issues, which they are not trained to do.
"I´m no longer spinning my wheels trying to help somebody…just the idea that somebody who is skillful and understands the population – where they are, and where they´re living, and what life looks like for them – when that´s being handled, the benefit is that the patient can come in and talk to us about their health and to know that they have a [CCC social worker] for X amount of days, months, working on something with them. It helps us to focus on good primary care when the patient´s in the office."
Providers feel more confident that patients are receiving services that matter for their overall wellbeing.
"Well, because Lifespan´s involved with helping set up resources for the patients, it gives me a little bit more peace of mind that I know that they´re getting that extra help to help meet some of their needs and allows me to do other things too. And I´m still involved with the patients but once I know that Lifespan is involved, and I know what programs are set up, and I can write all of that stuff in their chart, so I know what they´re getting as far as help or whatever resources they´re set up with. And I know that now the patient has a better chance to get to their appointments and getting to the lab and seeing their specialists and things like that."
"The Community Care Connections program – we have a lot of our patients who´ve been referred to them and it´s been very, very helpful. To me, especially because I´m one person covering many offices, I can´t do some of the things that they can do. They can go out and see patients in their home. I can´t do that. So, it´s been very helpful when we´ve had the need."
CCC Patients / From Interviews Conducted by NYAM:
Patients report that the program improves their mental and physical health
"[Through Lifespan] I talked to dieticians – they´re helping me to develop a diet that will be helpful to me. I am a diabetic, and I´ve not been in control of my diabetes for a long time. I am starting now to get much better control,my A1Cs are going down, so every service that they have provided to me have been very, very helpful."
"Lifespan did talk to them about the inhalers, and they did get me the inhalers that I needed and made sure I had the right ones. XXX Agency brought in the box for – emergency box. And, yes, Lifespan had something to do with that. So, yes, they´re pretty good about making sure that my home is safe and I´ve got the proper equipment… [my CCC Healthcare Coordinator] helped with making sure that I had the right equipment, and how to use it, and then if I go outside, what I had to do when I went outside, and stuff like that. Yes, she was a big help on helping me with that."
Patients report that CCC reduces missed appointments and improves communication with health care providers.
"Oh,yes.LikeIsaid,shebroughtmeacalendarsoIcouldfillinthedates…LikeIsaid,Iwasmissing appointments because if I don´t write them down and I don´t have an appointment book or a calendar I forget them. Sometimes when the doctors´ offices call and remind you a day or two ahead, if I´m not where I can write it down, I forget it. So, she has a copy of all of my appointments, so she will call me and say" remember,you have an appointment today at 1:00."
Patients report that the program reduces caregiver stress and burnout
"Just that I´m a lot happier, and I have more energy, and I´m sure that my husband is, probably, much better off too. Because now we have a chance, in between visits of other people and other stuff, I can get him in the car, and we´ll go for a ride, or something. So, he´s getting a lot of attention from the people that come in, and that we see at the [adult day program], so I think that our quality of life is improved vastly since we have connected with this program… Well, it certainly helped our mental health. I mean, I was going absolutely crazy. So, you know, having this resource, and having someone I can call if I need something, has been a great thing. Because I just didn´t know it was there and available, and I just am so thrilled that we have this."
"Well, it´s been great. When this first started, you know, since he was in the hospital, I had to cancel my dental cleaning, I didn´t make it to a doctor´s appointment, and that sort of thing. And since I got respite care, and I was able to count on people that would be here, I´ve made appointments, I saw my primary care doctor, and I´m doing very well. And I got my dental appointments. You know, when you´re a caregiver you put that stuff on hold because you don´t think it´s as important. But it is because when you´re a caregiver you have to take care of yourself too, or you can´t care for someone else."
Community Care Connections Work Plan Objectives
OBJECTIVE: A minimum of one contract for sustainable funding for Community Care Connections will be obtained with an Accountable Health Organization, Managed Care Organization, physician practice or insurer by 12/31/2019.
Result: Achieved
Three (3) Contracts and Three (3) Grants Obtained:
All are demonstration projects with a goal to establish a sustainable payment model.
Excellus BCBS (1/1/2020 – 12/31/2022). Excellus BCBS (insurer) asks that Lifespan focus on serving the Medicare Advantage plan beneficiaries with the new regulations in mind that support insurance payment for community-based services that address the social determinants of health.
Rochester Primary Care Network (FQHC) (7/1/2019 – 6/30/2020, no cost extension through 12/31/2020). Rochester Primary Care Network (FQHC) has a large Medicaid and Spanish-speaking population that is in significant need of linkage to community-based services.
Lifespan has maintained a contract with Accountable Health Partners (ACO) (9/15/2018 – 12/31/2020).
A grant from the Greater Rochester Health Foundation was approved and executed on 5/30/2019 for the period of 7/1/2019 through 6/30/2022.
A grant contract with Western and Central NY Health Foundation was approved and executed on 12/4/19 for the period of 1/1/2020 through 12/30/2022 to expand CCC into Genesee County. The Greater Rochester Health Foundation provided additional funding to support the expansion.
A grant contract with NY State Health Foundation was approved and executed on 3/23/2020 for the period of 4/1/2020 through 3/31/2023: Testing an Innovative Model of Geriatric Substance Use Addiction.
OBJECTIVE: 60% of patients/caregivers will access at least one new community-based support service.
Result: Achieved 78%
- 4,100 total non-CCC service connections * made for 1,444 patients
- Average of 2.83 non-CCC service connections per client
- Range of service connections per client: 0-18
Service Connections by # of Services
| # of Services | N | % |
|---|---|---|
| 0 | 305 | 21% |
| 1 | 270 | 19% |
| 2 | 251 | 17% |
| 3 | 180 | 12% |
| 4 | 135 | 9% |
| 5 | 88 | 6% |
| Greater than 5 | 215 | 15% |
OBJECTIVE: 60% of caregivers will report a decrease in stress as compared to a baseline measure.
Result: At case closure, 98% of caregivers reported a decrease in stress.
OBJECTIVE: 85% of patients will advance at least one grade in at least one domain of the Older Americans Resources and Services Scale (OARS).
Result: Based on pre- and post-OARS administration 93% of patients served advanced at least one grade in at least one domain of the OARS.
OBJECTIVE: Achieve 90% patient/caregiver satisfaction that they are getting the assistance, information and / or services they need by the close of CCC service.
Result: 98% of patients/caregivers reported satisfaction that they are getting the assistance, information and / or services they need by the close of CCC service.
OBJECTIVE: At case closure, 60% of caregivers will report a decrease in stress.
Result: At case closure, 92% of caregivers reported a decrease in stress.
OBJECTIVE: Increase patient/caregiver quality of life by close of service based on pre- and post-score comparison.
Result: 92% of respondents in the quarter reported an increase in quality of life, 90 days post case closure.
Quantitative Work Plan Objectives
| Work Plan Target (8/1/18 – 12/31/19) |
Total | |
|---|---|---|
| Total unduplicated patients enrolled for co-located care navigators access point and for "non-contracted" physician practices | 260 | 677 |
| Total patient enrollment for Social Work Care Navigators | 230 | 490 |
| Total patient enrollment for Healthcare Coordination | 30 | 163 |
| Total patients maintained on the Community HealthWorker caseload – Goal 20: | 20 | 20 |
| Total physician practices willing to co-locate care navigator | 1 | 1 |
| Total physician practices without co-located social workers | 35 | 65 |
| Total home health care agencies | 3 | 3 |
| Total client enrolled in Matter of Balance and Chronic Disease Management | 15 | 543* |
| Total enrolled in Home Safe Home | 13 | 23 |
| Number patients who received Meals on Wheels: | — | 7 |
| Number of patients who received urgent transportation: | — | 55* |
*includes classes at all sites in the community, not just classes that occur at Lifespan.
Significant Service Linkages and Their Impact
Home Health Aide – Personal Care – Those who were connected had a 60% decrease in hospitalization and a 61% decrease in emergency room visits post enrollment.
Health Insurance Counseling – A Lifespan service that provides accurate and objective information about Medicare and all related insurances. Those who were connected had a 55% decrease in hospitalizations.
Medical Provider Specialist – Those who were connected had a 55% decrease in hospitalizations.
Financial Benefits Counseling – Lifespan Care Managers conduct a benefits screening to determine what the person is eligible for and then assist with applications. Those who were connected had a 47% decrease in hospitalizations and a 41% decrease in emergency room visits.
Minor Home Modifications / Home-Safe-Home – This is a Lifespan service that provides minor home modifications to prevent falls. Those who received this service had a 47% decrease in emergency room visits.
Medicaid – Those who were connected had a 46% decrease in observation stays.
Housekeeping - Those who were connected had a 39% decrease in ED visits.
Transportation – Community Care Connections funded transportation through Medical Motors for those without Medicaid and who had no other option to attend an urgent medical appointment. Those who received funded transportation had a 26%decreasein hospitalizations and a 26%decreasein emergency room visits post enrollment.
Case Studies
Karin (CCC Social Work Care Manager) received a referral from a nurse care manager at a primary care office for their patient, Mr. C. The nurse was concerned because Mr. C. lived alone and reported he´s been without water. He is medically complex and admitted to struggling to maintain his home. Karin knew from asking safety questions that the condition of the house was a concern but what she found was more than expected. The house was in extreme disrepair and was infested with insects, rodents, squirrels, mold and evidence that this gentleman could no longer attend to his personal care. The client admitted there´s been no running water for about 10 years and that his furnace is broken. He reported having no one to help him. He was still driving on a regular basis but admitted he shouldn´t because it isn´t safe.
Mr. C. was willing to move but to where? And could this get done before cold weather hits? Thankfully Karin was ready to assist him with this challenge! She facilitated Mr. C. gathering his financial statements, medical documentation, transportation to his appointments and tours at assisted living facilities (and met him there for support), found a realtor, found a car dealer willing to buy the car and got him moved into the facility of his choice – all by early October! He did not have one stitch of clean clothes so Karin (with approval and access to funds) shopped for him so he would look nice when he moved in. One of the first things Mr. C. said when he entered his new home was "Hey, running water!" and gave her a big thumbs up.
"I have been working with C. for a couple of years. She has CHF and A-fib among other diagnoses. She is a shy, pleasant woman who lives with her husband and until last year, her 20-something son. C. struggled to remember to take her medications. Because she takes blood pressure medications and medications to control her heart rate, she would often be sent to the ED from work with chest pain and shortness of breath. The first step was switching her to a pharmacy that could provide her with prefilled medi-sets. I also counseled her on what her medications were for and the benefits of taking them. I coupled that with home support visits to see how well she was remembering her medications. This would work for a time but not long term. I had heard about a new talking alarm clock called the Reminder Rosie and thought that might work well for her. To get it free she would have to switch pharmacies. That was not ideal, so I worked with the social worker at her PCP office who applied for a grant for the Reminder Rosie. The grant was awarded, and the Reminder Rosie was ordered and sent to me. I set up the Reminder Rosie at C´s house. Since the Reminder Rosie has been set up, her compliance with taking her medications has been over 90%. (Previously it had been around 50% at best.) The unit was set up in late August and she has only had one ED visit in the remainder of the year. She was discharged the same day as the ED visit. Prior to August she had three ED visits which all resulted in a 1- to 3-day hospital stay, usually in observation. These visits required administration of additional medications, echocardiograms, ultrasounds and sometimes chest x-rays."
– Carol Sapp, LPN Healthcare Coordinator
Barriers
Although the Community Care Connections program has achieved a number of successes, barriers and limitations have been identified. First, it was more difficult than originally anticipated to create a propensity-score matched control group, due to unexpected data quality issues for the control group. Unfortunately, the variables available for use in the matching analysis were extremely limited. For example, data on diagnosis for the control group was not of sufficient quality and could not be used for matching purposes. As a result, matching relied only on a few limited demographic characteristics, which made the creation of a reliable and valid control group a major challenge in this project.
Additionally, Lifespan has not been able to engage Managed Care Organizations (MCOs) in contract arrangement discussions. Our understanding is that the DSRIP Waiver would have included a requirement that MCOs partner with community-based organizations at a more advanced level than is currently required. The DSRIP Waiver for New York State was not extended by the Centers for Medicare and Medicaid Services earlier this year.
The question remains: who should pay for community-based organizations´ work to address the social determinants of health? Community Care Connections continues to explore the answer with a variety of payer types.
Lessons Learned
Over the course of this project period, the project team learned several lessons that will inform program implementation and evaluations in the future.
- Sample size matters. More specifically, the larger the sample, the more confident we feel that findings are valid and not the result of a few high utilizing outliers, which can skew the data.
- Payers want dedicated resources and tailored reports. They are often interested in seeing an evaluation focused only on their own patients/cohort. When this is the case, it is essential to ensure that payers are aware of and understand the nuances in data interpretation that result from having a smaller sample in the analysis.
- Data access – while an essential component of the evaluation – is often out of our team´s control. The control group analysis faced significant delays due to a data system overhaul that took place at the Rochester RHIO during the research project period. As a result, researchers at NYAM were delayed in developing and testing the methodology for a control group.
- Persistence is key for sustainability. Generating interest and finding sustainable funding is hard work. Lifespan has conducted presentations to a variety of potential payers and funders, as well as other community organizations and government agencies, to generate interest in the CCC program, with the goal of identifying a sustainable funding mechanism for the CCC program. This work has resulted in new contracts and demonstration projects, but the process of identifying and engaging committed funders is long and many obstacles remain.
- Outcomes that matter often can´t be easily tracked and analyzed. While data on hospitalizations and ED visits is of great interest to many, the events are relatively rare and, thus, relying on them as the primary outcome measures limits our ability to understand the extent of the impact of the CCC program. In the future, we plan to seek methods of understanding the CCC program´s impact on more intermediate outcomes, such as medication adherence, preventative health care access, and more.
- Patients 85 years and older are most vulnerable to hospitalization and can benefit from more LPN healthcare coordination enrollment.
Lifespan has further developed experience that can be shared. Lifespan can mentor and offer tools to assist other community-based services providers with evaluation design, value proposition and program development.
Lifespan can share tools and strategies for:
- Developing a plan for evaluation:
- Data points of greatest interest to payers.
- When Institutional Review Board (IRB) approval is necessary, preparing for IRB approval. IRB review serves an important role in the protection of the rights and welfare of human research subjects. The purpose of IRB review is to assure, both in advance and by periodic review, that appropriate steps are taken to protect the rights and welfare of humans participating as subjects in the research.
- Working with a health information organization to provide healthcare encounter data.
- Integration of workflows with physician practices and home healthcare agencies.
- Social work and healthcare coordination interventions that have the greatest impact on health outcomes.
- Developing strategies and a value proposition to engage payers in sustainable payment model discussions.
- Contracting with payers.
Achievements
Lifespan has established a true integrated partnership with 65 physician practices that works because of the following elements aimed to make it as easy as possible to access and utilize CCC:
- A dedicated referral phone line answered by the CCC Program Coordinators who can triage and quickly assign referrals.
- A HIPAA compliant on-line referral form is offered as an alternative to phone referrals.
- Assigned CCC care managers call the referral source to confirm connection with the patient.
- Following the Geriatric Wellness Screen completed by CCC staff, initial care plans that outline client driven goals to be addressed are sent securely to the RN Care Manager/referral source. Most practices scan the care plan into the Electronic Medical Record.
- Upon case closure, the closing care plan that identifies goal accomplishment is sent to the RN Care Manager/referral source.
Lifespan was able to work with Peer Place, our care management data platform, to create a robust dashboard report that makes it possible to produce real-time enrollment numbers, demographics and key result indicator outcomes. This has been a significant advance in our ability to report progress to funders in a timely fashion. In concert with evaluation by NYAM, we have used data analytics to support value proposition presentations to engage Independent
Practice Associations, Accountable Care Organizations and Managed Care Organizations in contract discussions to create a model of care that supports transition to a sustainable payment model.
The RN Program Coordinator has further refined the definitions for client level of need for LPN healthcare coordination. This methodology used during supervision of case reviews serves two purposes: (1) identification of the client progress toward increased health literacy, increased ability to self-manage health concerns and subsequent readiness to "graduate" from the program; and (2) achieves case load balance for the LPN HCCs with a maximum value of 30 patients, ensuring service quality.
Lifespan and NYAM have disseminated the results of the evaluation in multiple ways:
- Presented a poster at the Interdisciplinary Association for Population Health Science (IAPHS) conference, October 2018.
- Presented a poster at the Virtual Academy Health Research Conference, July 2020.
- Submitted a manuscript to American Journal of Preventative Medicine.
- Health Affairs Grant Watch Blog post published: Working Across Sectors To Improve Health For Older People: The Community Care Connections Program. https://www.healthaffairs.org/do/10.1377/hblog20200129.627279/full.
- Presented multiple webinars via Robert Wood Johnson Foundation S4A program.
- Conducted presentations on findings at:
- The New York Academy of Medicine Brown Bag Lunch Series
- The Columbia School of Nursing
- Tuskegee University
- Center for Medicaid and Medicare Services
- Tecnológico de Monterrey (Monterrey Institute of Technology), Mexico City
Lifespan´s Community Care Connections was awarded the Archstone Foundation award for program innovation on November 4, 2019.
Conclusions
Support from the New York State Department of Health made it possible for Lifespan to develop a model that integrates community-based services into healthcare systems. Independent evaluation of Community Care Connections (CCC) has shown the positive impact of addressing the social determinants of health on older adults´ satisfaction, health outcomes and subsequent cost savings.
Lifespan has successfully demonstrated the value of CCC to payers, resulting in newly established contracts for demonstration projects with an Accountable Care Organization, an insurer and an FQHC, as well as foundation grants. Lessons learned are paving the way for replication of community-based organizations´ role in the achievement of healthcare metrics critical to payment arrangements.
Lifespan has collected and reported meaningful data, therefore proving the value of integrating community-based services with healthcare. Independent evaluation by NYAM has shown high levels of satisfaction with the intervention from patients, caregivers and the medical provider community. Improved healthcare outcomes and quality of care have been achieved. Healthcare costs savings are evident with a decrease in ED visits, hospitalizations and observations stays in the 90 days post enrollment.
Lifespan has established the key components of the CCC program that make it work. These elements can be generalized to other community-based providers:
- The CCC program offers medical providers and patients a central, trusted point of contact for addressing nonclinical health issues.
- The CCC program closes communication gaps: patients, providers, and Lifespan staff describe multiple ways that the CCC program contributes to improved communication with patients and across care settings.
- The CCC program offers Lifespan staff the time and flexibility to provide holistic and comprehensive care to patients.
Recommendations
A collaborative approach to establishing outcome metrics at the outset of a partnership with a funder is critical. A statement of work should clearly outline expectations.
Regular communication with funders is critical to a successful partnership. Some flexibility is needed to adjust workflow as the partnership evolves.
To meet enrollment targets, it is best to be as inclusive as possible when defining intake criteria. However, if measurement of success is dependent on reducing healthcare utilization, patients who have had ED and/or hospitalizations prior to program enrollment should be prioritized.
Appendix
Study (1)
The ongoing analysis by New York Academy of Medicine (NYAM) for patients served from June 10, 2016 through December 31, 2019.
Contents
Appendix 1. Demographics
Appendix 2. Diagnoses
Appendix 3. Length of Time in CCC
Appendix 4. Top Service Connections
Appendix 5. 90-day Pre/Post Analysis
Percent changes in healthcare utilization analyzed by:
- Hospitalizations, Emergency Room Visits and Observation
- Health Condition
- # of diagnosis categories
- Service Connection Appendix
Appendix 6. Medicaid Sub-Analysis
Appendix 7. Return on Investment (ROI) 90-day Pre/Post Analysis
Appendix 8. Professional and Patient/Family Testimonials
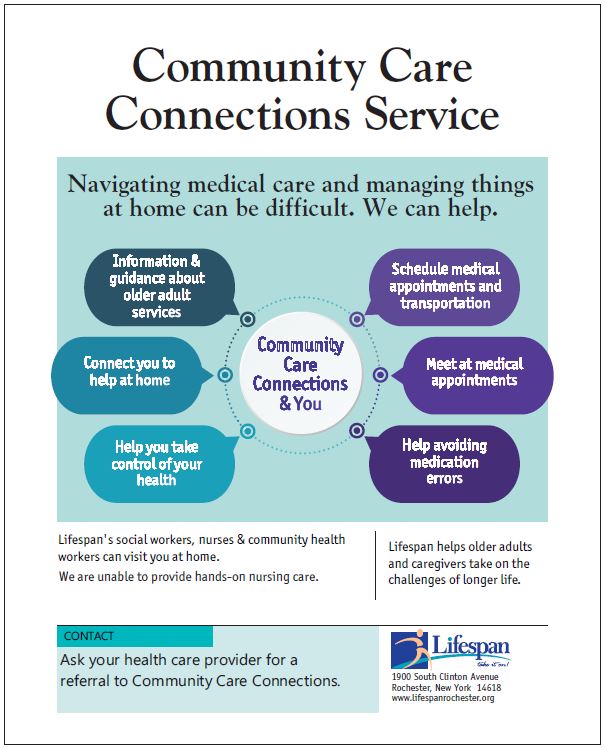
Appendix 9. Community Care Connections Services Flyer
THE NEW YORK ACADEMY OF MEDICINE | HEALTHY CITIES, BETTER LIVES
1. Demographics
| Total (N) | Percent (%) | |
|---|---|---|
| Total | 1,467 | |
| AGE | ||
| <65 | 149 | 10% |
| 65-74 | 373 | 25% |
| 75-84 | 529 | 36% |
| 85+ | 405 | 28% |
| Not Available | 11 | 1% |
| GENDER | ||
| Female | 915 | 62% |
| Male | 533 | 36% |
| Not Available | 19 | 1% |
| RACE | ||
| White | 1,141 | 78% |
| Black/African American | 202 | 14% |
| Other | 21 | 1% |
| 2 or more | 2 | 0.1% |
| Not Available | 101 | 7% |
| ETHNICITY | ||
| Hispanic/Latino | 39 | 3% |
| Not Hispanic/Latino | 1,290 | 88% |
| Not Available | 138 | 9% |
| MONTHLY INCOME | ||
| <$1000 | 605 | 41% |
| $1000-$1499 | 303 | 21% |
| $1500-$1999 | 209 | 14% |
| $2000-$2499 | 151 | 11% |
| >$2500 | 199 | 14% |
| PUBLIC INSURANCE | ||
| Medicaid Only | 33 | 2% |
| Medicare Only | 996 | 68% |
| Dual Eligible | 208 | 14% |
| Neither Medicare nor Medicaid | 32 | 2% |
| Not Available | 198 | 14% |
| COUNTY | ||
| Monroe | 1,075 | 73% |
| Other | 365 | 25% |
| Not Available | 27 | 2% |
| LIVES… | ||
| …Alone | 646 | 44% |
| …with Spouse Only | 353 | 24% |
| …with Others* | 351 | 24% |
| Not Available | 117 | 8% |
2. Diagnoses
| Condition | N | %* |
|---|---|---|
| Hypertension | 664 | 50% |
| Diabetes | 441 | 33% |
| High Cholesterol | 341 | 26% |
| Depression | 325 | 24% |
| Arthritis | 272 | 20% |
| Chronic Obstructive Pulmonary Disease | 255 | 17% |
| Dementia | 187 | 14% |
| Coronary Artery Disease | 169 | 13% |
| Heart Failure | 144 | 11% |
| Cancer | 127 | 10% |
| Kidney Disease | 126 | 9% |
| Stroke | 116 | 9% |
*Clients may have multiple conditions and/or diagnoses not reported in this table; health conditions listed here are based on the top 10 most prevalent health conditions among Medicare beneficiaries along with those of interest to the CCC program
* *Diagnosis data available for 1,334 clients
NUMBER OF DIAGNOSIS CATEGORIES PER CLIENT
| # of Health Condition Categories |
# of Clients | %** |
|---|---|---|
| 0*** | 77 | 6% |
| 1 | 196 | 15% |
| 2 | 298 | 22% |
| 3 | 359 | 27% |
| 4 | 221 | 17% |
| 5 or more | 183 | 14% |
*Clientsmay have multiple conditions within a given diagnosis category
* *N = 1,334 due to missing or incomplete data
* * * = 0 conditions may reflect data entry errors and/or clients who chose not to report health conditions, or who have conditions that do not fall into one of the categories described.
Health condition types include:
- Heart
- Metabolic
- Intestinal
- Urinary
- Skeletal
- Infection
- Vision
- Pulmonary
- Psychological
- Neurological
- Cancer
- Nutritional
3. Length of Time in CCC
- 1,467 clients joined CCC and provided consent for data sharing between June 10, 2016 and September 1, 2019.
- 86 cases open, 1,381 cases closed.
- Of those with closed cases, the median program length was 116 days (mean = 156 days).
- 25th percentile: 62 days.
- 75th percentile: 192 days.
- Range: 0 - 1,256 days.
4. Top Service Connections
| Type of Service | # Referred |
|---|---|
| Care Management | 1,273 |
| Caregiver Support | 378 |
| Financial Benefits Counseling | 358 |
| Transportation | 295 |
| Health Care Coordination | 283 |
| Home Health Aid/Personal Care | 224 |
| Medicaid | 208 |
| Home Modification | 208 |
| Health Insurance Counseling | 204 |
| Durable Medical Equipment | 202 |
| Medical Provider Specialist | 191 |
| PERS | 189 |
| Housekeeping | 180 |
5. 90-Day Pre/Post Analysis
- The following presents information on changes in hospitalizations, emergency department visits, and patients held for observation among CCC clients. We conduct analyses examining health care utilization at 90 days before and after program enrollment based on data provided from the Rochester Regional Health Information Organization (RHIO) and Lifespan.
- Hospital encounter data (90 days pre/post) was available for 1,467 clients who enrolled in CCC prior to 9/1/2019.
Hypothetical example:
a. Changes in Hospitalizations, Emergency Room Visits and Observations.
i. Average number of hospitalizations, emergency department visits, and observations per client decreases after 90 days of CCC program participation.
| # of CCC Clients (N) | Pre-CCC | Post-CCC | % Change | |
|---|---|---|---|---|
| Hospitalizations | 1,467 | 0.109 | 0.085 | −22% |
| ED Visits | 1,467 | 0.393 | 0.272 | −30%* |
| Observations | 1,467 | 0.162 | 0.127 | −22%* |
ii. More clients have zero hospitalizations and fewer clients have multiple hospitalizations 90 days after enrolling in CCC.
| Hospitalizations | # of CCC Clien Pre-CCC | ts Post-CCC |
|---|---|---|
| 0 | 1,337 | 1,368 |
| 1 | 106 | 84 |
| 2 | 19 | 9 |
| 3 | 4 | 2 |
| 4 | 1 | 3 |
| 5 | 0 | 1 |
iii. More clients have zero emergency department (ED) visits and fewer clients have multiple ED visits 90 days after enrolling in CCC.
| # ED Visits | # of CCC Clien Pre-CCC |
Post-CCC |
|---|---|---|
| 0 | 1,108 | 1,212 |
| 1 | 228 | 168 |
| 2 | 81 | 52 |
| 3 | 31 | 24 |
| 4 | 12 | 6 |
| 5 | 2 | 2 |
| 6 | 3 | 1 |
| 7+ | 2 | 2 |
iv. More clients have zero observations and fewer clients have multiple observations 90 days after enrolling in CCC.
| Observations | # of CCC Clien Pre-CCC |
Post-CCC |
|---|---|---|
| 0 | 1,313 | 1,339 |
| 1 | 99 | 93 |
| 2 | 38 | 24 |
| 3 | 9 | 6 |
| 4 | 6 | 3 |
| 5 | 1 | 0 |
| 6 | 0 | 1 |
| 7+ | 1 | 1 |
b. 90-day Pre/Post Analysis: Percent changes by Health Condition
i. Hospitalizations by Health Condition
| Condition | N | Pre-CCC | Post-CCC | % Change |
|---|---|---|---|---|
| Hypertension | 664 | 0.10 | 0.08 | −20% |
| Diabetes | 441 | 0.10 | 0.10 | 0% |
| Cholesterol | 341 | 0.09 | 0.09 | 0% |
| Depression | 325 | 0.09 | 0.09 | 0% |
| Arthritis | 272 | 0.07 | 0.07 | 0% |
| COPD | 255 | 0.13 | 0.11 | −15% |
| Dementia | 187 | 0.03 | 0.05 | 67% |
| Heart Disease | 169 | 0.11 | 0.09 | −18% |
| Cancer | 144 | 0.18 | 0.15 | −17% |
| Heart Failure | 127 | 0.14 | 0.10 | −29% |
| Kidney Disease | 126 | 0.11 | 0.17 | 55% |
| Stroke | 116 | 0.09 | 0.07 | −22% |
No changes are significant at p<.05
ii. ED Visits by Health Condition
| Condition | N | Pre-CCC | Post-CCC | % Change |
|---|---|---|---|---|
| Hypertension | 664 | 0.39 | 0.27 | −31%* |
| Diabetes | 441 | 0.44 | 0.34 | −23%* |
| Cholesterol | 341 | 0.36 | 0.28 | −22%* |
| Depression | 325 | 0.45 | 0.32 | −29%* |
| Arthritis | 272 | 0.37 | 0.30 | −19% |
| COPD | 255 | 0.62 | 0.39 | −37%* |
| Dementia | 187 | 0.20 | 0.15 | −25% |
| Heart Disease | 169 | 0.40 | 0.37 | −8% |
| Heart Failure | 144 | 0.81 | 0.45 | −44%* |
| Cancer | 127 | 0.51 | 0.44 | −14% |
| Kidney Disease | 126 | 0.50 | 0.40 | −20% |
| Stroke | 116 | 0.37 | 0.22 | −41% |
Note: clients may have diagnoses not presented in this table
* Significant at p<.05
iii. Observations by Health Condition
| Condition | N | Pre-CCC | Post-CCC | % Change |
|---|---|---|---|---|
| Hypertension | 664 | 0.14 | 0.09 | −36%* |
| Diabetes | 441 | 0.22 | 0.12 | −45%* |
| Cholesterol | 341 | 0.19 | 0.10 | −47%* |
| Depression | 325 | 0.18 | 0.11 | −39%* |
| Arthritis | 272 | 0.17 | 0.14 | −18% |
| COPD | 255 | 0.18 | 0.10 | −44%* |
| Dementia | 187 | 0.14 | 0.10 | −29% |
| Heart Disease | 169 | 0.24 | 0.22 | −8% |
| Heart Failure | 144 | 0.3 | 0.17 | −43%* |
| Cancer | 127 | 0.15 | 0.10 | −33% |
| Kidney Disease | 126 | 0.20 | 0.14 | −30% |
| Stroke | 116 | 0.16 | 0.15 | −6% |
Note: clients may have diagnoses not presented in this table
* Significant at p<.05
c. Percent Change in Health Care Utilization by # of Diagnosis Categories
| # of Health Condition Types | # of Clients | % Change (Hospital) | % Change ED | % Change Observations |
|---|---|---|---|---|
| 0 | 77 | −59%* | −57% | −47% |
| 1 | 196 | −46% | −49%* | 26% |
| 2 | 298 | 0% | −43%* | −19% |
| 3 | 359 | −27% | −11% | −31% |
| 4 | 221 | 25% | −14% | −35% |
| 5 or more | 183 | 10% | −35%* | −47%* |
d. Health Care Utilization by Service Connection
| Service | N | Hospitalizations | ED Visits | Observations |
|---|---|---|---|---|
| Case Management | 1,273 | −27%* | −33%* | −25% |
| Caregiver Support | 378 | −27% | −19% | 0% |
| Financial Benefits Counseling | 358 | −47%* | −41%* | −8% |
| Transportation | 295 | 33% | −26%* | −26% |
| Health Care Coordination | 283 | 100% | −13% | −24% |
| Home Health Aid/Personal Care | 224 | −17% | −39%* | −21% |
| Medicaid | 208 | −9% | −5% | −47%* |
| Home Modification | 208 | 57% | −47%* | −31% |
| Health Insurance Counseling | 204 | −55%* | −30% | −20% |
| Durable Medical Equipment | 202 | −8% | −15% | −24% |
| PERS | 191 | 25% | 0% | 33% |
| Medical Provider Specialist | 189 | −54%* | −26% | −23% |
| Housekeeping | 180 | −64%* | −47%* | −21% |
6. Medicaid Sub-Analysis
90 Day Pre/Post Healthcare Utilization Analysis
205 * total Medicaid clients joined CCC and provided consent for data sharing between June 10, 2016 and March 1, 2019.
| Total # (Pre-CCC) | Total # (Post-CCC) | % Change | |
|---|---|---|---|
| Hospitalizations | 19 | 16 | −16% |
| ED Visits | 82 | 73 | −12% |
| Observations | 47 | 28 | −40% |
*Number of clients included in analyses varies due to missing/incomplete data.
7. Return on Investment (ROI) 90 Day Pre/Post Analysis
Every dollar spent on the CCC program is associated with an estimated $3.42 in reduced costs related to hospitalization, ED visits and observations (using a 90-day analysis).
| Pre-CCC | Post-CCC | ||
|---|---|---|---|
| Number of Patients | 1467 | ||
| Average Number Per Client | |||
| Hospitalizations | 0.436 | 0.340 | |
| ED Visits | 1.572 | 1.088 | |
| Observations | 0.648 | 0.508 | |
| Admission Cost Per Patient ($) | |||
| Hospitalizations | 13,964 | ||
| ED Visits | 937 | ||
| Observations | 2,091 | ||
| Total Health Care Costs* ($) | |||
| Hospitalizations | 8,931,664 | 6,965,059 | |
| ED Visits | 2,161,870 | 1,496,256 | |
| Observations | 1,988,085 | 1,558,561 | |
| Total CCC Program Costs ($) | |||
| Per Client | 610 | ||
| Total | 894,870 | ||
| Total Savings ($) | |||
| Hospitalizations | 1,966,605 | ||
| ED Visits | 665,614 | ||
| Observations | 429,525 | ||
| ROI | 242% | ||
These analyses assume that the CCC program serves 1,000 clients and costs $610,000 per year. Average costs for hospitalizations and ED visits were calculated using data from the 2017 Medical Expenditure Panel. Average cost for an observation was extrapolated from a 2013 US Surgeon General report using data from the Health Care Cost and Utilization Project (Department of Health and Human Services, 2013). *All costs were adjusted to 2019 dollars using the Consumer Price Index for Medical Services for all Urban Consumers.
* Hospitals´ Use of Observation Stays and Short Inpatient Stays for Medicare Beneficiaries
ESTIMATED ADMISSION COSTS: 90 DAYS PRE/POST
8. Professional and Patient / Family Testimonials
Lifespan´s Healthcare Coordination Service has been invaluable for Janette. Without this program Janette would not make it to any of her medical appointments. Her nurse, Kathleen, schedules and tracks her medical appointments, calls her the day of the appointment as a reminder, helps her navigate check-in/out and the health care system, accompanies her to appointments to advocate and ensures she understands the health information and medical plan. Again, this program is an invaluable service to the community and for older adults who have difficulty navigating the healthcare system.
– Susan Ruhlin, LMSW, Social Worker, Memory Care, URMC
Just dropping a brief note with a huge message. I think your healthcare coordination program is a lifesaver.
I would particularly like to shout out to Melanie Jones. I will tell you, I was a bit hesitant to refer my patient to the program as I was unsure that it could be as good as it says it is on paper. Let me tell you, your program is. Melanie has turned around one of my high need patients whom had had other services in the home and community that could not seem to make a dent in her needs. Melanie regularly calls me or the PCP or vice-versa on a fairly regular basis to update and brainstorm – she has great insight and is a strong advocate. We spoke briefly in the past of how your program is set up and I would like to say I wish you don´t change the patient to care management ratio. I would love to be able to go on visits with my patients but, as I have so, so many very high-need patients I am required to follow, it would be impossible.
Any ways, I wanted to let you know how much I appreciate your Healthcare Coordination program and Melanie inparticular. Please feel free to call me if more detail is desired or needed.
Sincerely,
Janet Young BSN, RN Care Manager, RRHS Primary Care, GIM, White Pines, Northridge and WNY IM
Carol is my Godsend for my nephew, G.S. and his wife T.C. I live 2 hours away and I can´t get to his appointments.He doesn´t always tell me clearly what happens at the appointments, but Carol calls me to let me know. She tracks and schedules his appointments, meets him at the doctor´s office and communicates with me. He has so many appointments. Carol gives me a great sense of relief. His wheelchair needs to be fixed and Carol said not to worry, she will take care of it. She is a blessing.
– G.S´s Aunt Margaret
I have been working with Karin Nowicki for a little over two months. In this time, I have given two referrals to Lifespan which, unknowingly to me at the time, turned out to be much larger cases with high needs. In this time, Karin has never complained, appeared overwhelmed, acted distressed or been unprofessional. Both cases have uniquely been challenging, with what seems like new barriers arising regularly. She communicates promptly and appropriately, providing necessary information to ensure improved patient situations. She has also assisted me personally with understanding things outside of my role for the purpose of assisting the patients better when I myself have contact with them. Essentially, educating me so that the patient has consistency and reassurance of their situations.
Karin has been pivotal in these two cases, arriving at times that could have been catastrophically different without her catalytic involvement. She has done so with humbleness and grace, as well as with positivity and energy.Iam so thankful that she has helped touch these lives and assisted them. I would be happy to furnish more detail if need be. Please feel free to contact me and thank you again for all the very needed services you all provide.
– Erica Boccia BSN, RN, Behavioral Health Care Manager, Tri-County Family Medicine Program, Inc
I would like to take a moment to say thank you to Lifespan! My mom is 84 years old and lost her husband (my dad) 1.5 years ago after 64 years of marriage. I am their only child and live 1/2 hour away. I am also a widow with a young child, full-time job and a household to care for. My mom has always been a caretaker to our family and she´s recently had her own health struggles. Unfortunately, I simply cannot care for mom in the capacity she deserves as there are just not enough hours in the day, nor the flexibility for me to do so.
Mom had recently been diagnosed with the start of dementia, skin cancers on her face and arms, and requires several follow-ups with a cardiologist, her primary doctor and many other doctors whom she hadn´t been to in years.
Our primary doctor recommended Lifespan which is how we got teamed up with Melanie Jones. This service and Melanie have been a true blessing to us. She has been a true advocate for my mom and has coordinated countless doctor appointments along with transportation for mom to ensure her safety and make sure she sees the doctors she needs to see.
The skin cancers were very large and have taken many appointments in order to be surgically removed. It would have been impossible for me to have taken all the time needed to make these appointments and attend them with her. Melanie handled everything and met mom at every appointment and I´m happy to report that thanks to her and to Lifespan, my mom is finally cancer free!!
Your services are such a Godsend to families like ourselves and we can never say enough thank you´s for all you´ve done. You´ve been instrumental in keeping my mom living independently with quality of life while taking enormous amounts of pressure off my shoulders. Lifespan and Melanie Jones have literally saved our family in every way a family can be saved! THANK YOU!
Sincerely,Ramona
I just don´t know what I would do without [my health care coordinator]. She keeps me on target with my appointments and things, some of my appointments she actually goes there with me to make sure I understand what the doctor or therapist is telling me. To me she´s invaluable. Before I go associated with her I was missing appointments. She got me a calendar so I could write down everything… I talked to dieticians – they´re helping me to develop a diet that will be helpful to me. I am a diabetic, and I´ve not been in control of my diabetes for a long time. I am starting now to get much better control, my A1Cs are going down, so every service that they have provided to me have been very very helpful.
– CCC Client
I have been working with Sandy Schencke for several years now and she is always ready and willing to assist and has great follow-through. She has made a difference in many of my patients´ lives.
I have recently had more interactions with Healthcare Coordination and know the patients they are working with are getting good care and follow-up as needed.
This short note doesn´t even begin to express my thanks, but I wanted you to know they all deserve special Kudos. Thanks for having such and great and caring staff at Lifespan.
˜DeborahWayne,RNClinicalCareManager,MedicalAssociatesofHenrietta
7. Community Care Connections Service Flyer

Follow Us