Improving Care for Duals: Strategic Vision
- Document is also available in Portable Document (PDF)
United Hospital Fund
Mark Kissinger, Deputy Commissioner
Office of Long Term Care
July 14, 2011
Introduction
- Coordination challenges between Entitlement Programs
- Eligibility/Administrative Issues
- Service Delivery Duplication
- Individual: consumer; enrollee; recipient; patient
Partially Capitated Managed Long Term Care Plans
- Capitated for some Medicaid services only.
- Benefit package is long term care and ancillary services.
- Primary and acute care covered by FFS Medicare or Medicaid.
- 13 plans offer this product.
- May 2011 enrollment = 30,510.
Program of All-Inclusive Care for the Elderly (PACE)
- Capitated for all Medicare and Medicaid services.
- Most integrated of the MLTC models.
- Day center / clinic based.
- Provider network usually small.
- Benefit package includes all medically necessary services primary, acute and long term care.
- May 2011 enrollment = 3,645 Range = 47-2,610.
- Two new PACEs are being planned or under development.
Medicaid Advantage Plus (MAP)
- All plans must cover the state-defined Combined Medicare and Medicaid Benefit Package.
- Between Medicare and Medicaid - benefit package includes all medically necessary services (primary, acute and long term care).
- Plans must meet both Medicare and Medicaid requirements.
- Challenge is to have this appear seamless to the membe
- Eight plans now offer this product.
Populations Served in Managed Care
- Medicaid Managed Care (MMC) plans serve only non-dual Medicaid recipients.
- Managed Long Term Care (MLTC) plans currently serve individuals who are eligible for Medicare and Medicaid (duals) as well as non-duals:
- In the future, the primary target population for MLTC will be dual eligibles.
Mandatory Initiative for April 2012
- 1115 Waiver approval needed from CMS before we can begin.
- Require dual eligibles over 21, who need community-based long term care services for more than 120 days, to enroll in Managed Long Term Care or other approved care coordination models.
- Exact definition of community-based long term care services is under
Care Coordination Models
- Models that meet "guidelines specified by the Commissioner that support coordination and integration of services."
- Guidelines must address:
- Certain public health law requirements
- Payment methods that ensure provider accountability for cost effective quality outcomes.
- Includes Long Term Home Health Care Programs that meet the guidelines.
- Medicaid Redesign Team work group has been appointed to assist in development (and other roles).
- Guidelines to be posted on DOH Web site by November 15, 2011.
Initiate Mandatory Enrollment in New York City (April 2012 Target)
- Designing exact process for implementation:
Options include:- on reassessment;
- by borough.
- Consumer Choice preferred but Auto Assignment for those who do not.
- Must ensure continuity of care and service provider.
- Educational effort.
MLTC Applications
- New law eliminates previous requirement for designation by Senate, Assembly or Commissioner or Health before applying.
- Applications for new entities or new lines of business and expansions are posted on the DOH Web site
- Require legal structure, contracted network, descriptions of care management model, grievance system, other programmatic areas and financial capability and capitalization.
Dual Eligible Initiative (MRT 101)
- NYS received a CMS planning contract to develop a demonstration model or models for dual eligibles.
- Possible focuses of demonstration could include:
- Assumption of Medicare risk by NYS;
- Development of enhanced care coordination for nursing home residents;
- Promotion of existing MLTC initiatives; and
- Gain sharing demonstration.
- Planning activities include:
- Analysis of data on Medicare/Medicaid expenditures
- Stakeholder interviews and meetings
- Demonstration application due to CMS by April 2012
- If successful, implementation anticipated by Fall 2012
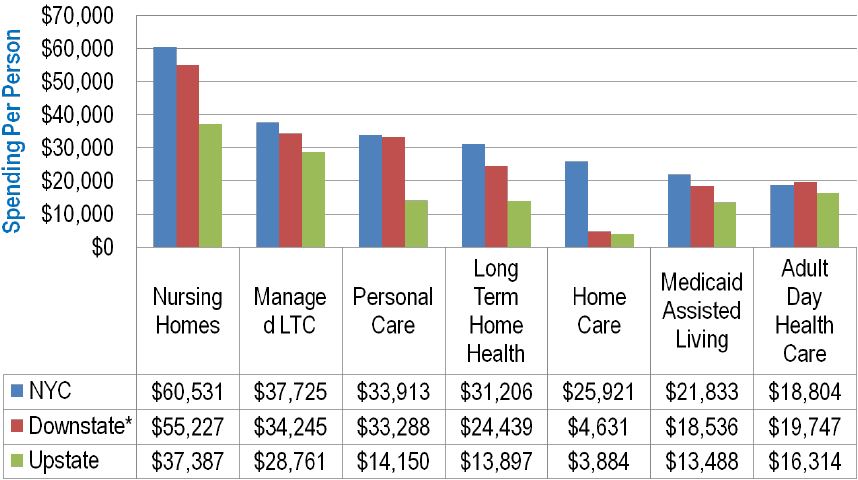
State of Medicaid Spending – LTC
Trend - Spending up 28%
| LTC Per Recipient Spending Trends by Service ($ 000) | |||||||
|---|---|---|---|---|---|---|---|
| 2003 | 2010 | % Change In Per Recipient Spending 2003 to 2010 | |||||
| # of Recipients | Total ($) | $ Per Recipient | # of Recipients | Total ($) | $ Per Recipient | ||
| Nursing Homes | 139,080 | $5,946,989 | $42,759 | 126,878 | $6,429,336 | $50,673 | 18.5% |
| ADHC | 16,365 | 266,248 | 16,269 | 17,303 | 318,273 | 18,394 | 13.1% |
| LTHHCP | 26,804 | 510,250 | 19,036 | 26,934 | 716,649 | 26,608 | 39.8% |
| Personal Care | 84,823 | 1,824,729 | 21,512 | 72,031 | 2,152,439 | 29,882 | 38.9% |
| MLTC | 12,293 | 444,341 | 36,146 | 37,843 | 1,401,362 | 37,031 | 2.4% |
| ALP | 3,538 | 50,488 | 14,270 | 5,217 | 93,096 | 17,845 | 25.1% |
| Home Care/CHHA | 92,553 | 760,347 | 8,215 | 87,366 | 1,551,546 | 17,759 | 116.2% |
| Total | 318,617 | $9,803,392 | $30,769 | 320,590 | $12,662,701 | $39,498 | 28.4% |
Nursing Facilities now account for over 51% of total 2010 LTC spending of $12.7 Billion
NYS Annual Medicaid Expenditure for Duals Identified as of December of Each Year 2003-2010
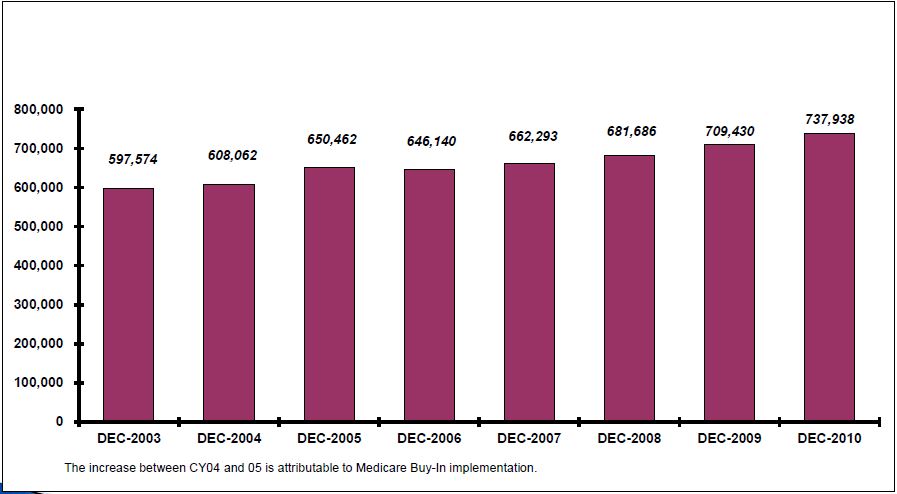
SUMMARY
NYS Annual Medicaid Expenditure for Duals Identified As Of December of Each Year Service Date: Calendar Year 2003 - 2010
| CY2003 | CY2004 | CY2005 | CY2006 | CY2007 | CY2008 | CY2009 | CY2010 | |
|---|---|---|---|---|---|---|---|---|
| Total Number of Dual Enrollees* | 597,574 | 608,062 | 650,462 | 646,140 | 662,293 | 681,686 | 709,430 | 737,938 |
| Total Medicaid Expenditures for All Services | $15,492,903,507 | $16,460,094,154 | $17,315,856,230 | $16,066,420,115 | $16,350,829,131 | $17,454,478,249 | $18,114,639,410 | $18,670,145,949 |
| Top 5 Medicaid Services | $10,456,839,280 | $11,083,138,029 | $11,713,427,921 | $12,227,769,109 | $12,619,649,658 | $13,371,418,852 | $13,693,214,745 | $14,166,701,267 |
| SKILLED NURSING FACILITY | 4,626,572,798 | 4,826,968,048 | 4,906,925,318 | 4,949,106,222 | 5,040,654,022 | 5,144,987,447 | 4,909,990,213 | 4,919,383,744 |
| COMM AND REHAB SERVICES (WAIVER SERVICES) | 2,110,555,552 | 2,370,720,798 | 2,687,024,800 | 2,902,638,734 | 3,125,025,243 | 3,567,624,144 | 3,925,858,701 | 4,143,914,585 |
| PERSONAL CARE | 1,496,664,462 | 1,604,418,162 | 1,757,881,322 | 1,829,743,988 | 1,888,149,020 | 1,880,752,474 | 1,793,994,083 | 1,724,166,463 |
| ICF/MR** | 1,720,408,478 | 1,732,648,470 | 1,714,921,779 | 1,741,909,997 | 1,732,927,211 | 1,869,233,610 | 1,986,661,004 | 2,136,403,959 |
| HOME HEALTH CARE (CHHAs) | 502,637,991 | 548,382,551 | 646,674,702 | 804,370,169 | 832,894,163 | 908,821,176 | 1,076,710,745 | 1,242,832,516 |
*Duals counts as of December of each year
**Includes OMH, OPWDD, TBI/NHTD/CAH Waivers, not LTHHCP.
Data Source: NYS DOH/OHIP DataMart
Top 5 Services by Growth in Medicaid Expenditures 2003-2010 (Duals)
*includes both Development Centers and Community Residences
Medicaid Expenditures and Utilization for Duals *
(Age Under 64) by Major Categories of Service 2010
Table 1-A
Medicaid Expenditures and Utilization for Duals* (Age Under 64) by Major Categories of Service
Service Dates: Calendar Year 2010
Source: DOH/OMM AFFP Datamart (based on claims paid through 5/2011)
| SURS Category of Service | Medicaid Expenditures | Total Service Units (Claims or Days) | Medicaid Recipients |
|---|---|---|---|
| All Medicaid Categories of Services | $7,606,882,706 | n.a. | 210,143 |
| Physicians | 38,802,902 | 3,191,333 | 160,322 |
| Psychology | 5,138,869 | 129,675 | 6,166 |
| Eye Care | 2,557,108 | 160,282 | 41,496 |
| Nursing Services | 28,538,742 | 147,400 | 951 |
| Hospital Based Clinics | 172,872,248 | 1,538,485 | 138,684 |
| ER** | 11,121 | 219 | 165 |
| D&TCs Clinics | 207,686,761 | 2,057,414 | 76,526 |
| OMH Operated Clinic | 4,370,050 | 17,595 | 1,521 |
| OMR Operated Clinic | 535,456 | 5,479 | 1,096 |
| School Supportive Health Services Program | 865 | 7 | 2 |
| Early Intervention | 69,753 | 890 | 11 |
| Inpatient | 177,608,220 | 135,184 | 43,050 |
| OMH Inpatient | 772,950 | 1,163 | 125 |
| OMR Inpatient | 1,360,826,304 | 345,824 | 1,036 |
| Skilled Nursing Facilities | 506,398,343 | 2,212,559 | 9,230 |
| Residential Treatment Facilities | 38,233 | 1,046 | 4 |
| Dental | 42,498,483 | 479,900 | 80,428 |
| Pharmacy | 109,197,518 | 2,374,234 | 136,311 |
| Non-Institutional Long Term Care | 470,920,810 | 3,825,906 | 20,017 |
| Personal Care | 241,587,306 | 1,838,077 | 8,802 |
| Home Care | 149,650,479 | 1,145,557 | 11,609 |
| Long Term Home Health Care | 71,100,315 | 739,143 | 2,964 |
| ALP | 8,111,592 | 85,249 | 423 |
| PERS | 471,119 | 17,880 | 1,985 |
| Laboratories | 1,738,647 | 113,487 | 24,465 |
| Transportation | 88,728,167 | 1,989,374 | 56,744 |
| HMO | 142,002,616 | 161,187 | 22,051 |
| CTHP | 248,188 | 5,478 | 1,476 |
| DME and Hearing Aid | 25,690,219 | 656,188 | 55,219 |
| Child Care | 92,636 | 2,338 | 10 |
| Family Health Plus | 4,457,877 | 18,043 | 2,813 |
| Referred Ambulatory | 7,829,421 | 235,473 | 42,674 |
| ICF-DD | 530,972,902 | 1,202,645 | 3,560 |
| Hospice | 2,768,348 | 588 | 103 |
| Community/Rehab Services | 3,458,506,947 | 6,347,288 | 40,335 |
| Case Management | 157,372,275 | 530,805 | 44,710 |
Top 5 Medicaid Services 2010 (Under 64)
- By Recipients:
- Physician
- Hospital Based Clinics
- Pharmacy
- Dental
- D&T Clinics
- By Expenditure:
- Community/Rehab/Services $3.5B
- ICF/MR $1.36B
- ICF/DD $530M
- SNF $506M
- Personal Care/Home Health $391M
Represents co-pays and deductibles paid by Medicaid for Duals.
Medicaid Expenditures and Utilization for Duals * (Age 65+)
by Major Categories of Services 2010
Table 1-B
Service Dates: Calendar Year 2010
Source: DOH/OMM AFFP Datamart (based on claims paid through 5/2011)
| SURS Category of Service | Medicaid Expenditures | Total Service Units (Claims or Days) | Medicaid Recipients |
|---|---|---|---|
| All Medicaid Categories of Services | $11,063,263,243 | n.a. | 400,559 |
| Physicians | 82,140,293 | 8,591,784 | 287,963 |
| Psychology | 9,261,175 | 240,882 | 14,497 |
| Eye Care | 5,531,036 | 397,659 | 87,425 |
| Nursing Services | 8,857,586 | 39,443 | 242 |
| Hospital Based Clinics | 109,566,885 | 1,110,230 | 170,792 |
| ER** | 11,144 | 133 | 109 |
| D&TCs Clinics | 71,603,974 | 824,199 | 45,055 |
| OMH Operated Clinic | 781,132 | 2,982 | 303 |
| OMR Operated Clinic | 143,228 | 1,560 | 371 |
| School Supportive Health Services Program | 0 | 0 | 0 |
| Early Intervention | 0 | 0 | 0 |
| Inpatient | 285,408,180 | 143,902 | 89,503 |
| OMH Inpatient | 59,392,567 | 70,626 | 310 |
| OMR Inpatient | 149,374,542 | 49,740 | 153 |
| Skilled Nursing Facilities | 4,412,985,401 | 21,980,848 | 80,737 |
| Residential Treatment Facilities | 0 | 0 | 0 |
| Dental | 46,547,084 | 483,905 | 77,895 |
| Pharmacy | 123,629,586 | 5,370,197 | 265,213 |
| Non-Institutional Long Term Care | 3,169,090,216 | 22,702,910 | 91,315 |
| Personal Care | 1,482,579,158 | 10,884,529 | 45,003 |
| Home Care | 1,093,182,037 | 5,985,725 | 38,196 |
| Long Term Home Health Care | 515,339,054 | 5,054,945 | 18,203 |
| ALP | 74,967,428 | 665,285 | 4,010 |
| PERS | 3,022,540 | 112,426 | 11,870 |
| Laboratories | 1,902,290 | 103,853 | 26,491 |
| Transportation | 192,357,168 | 3,578,210 | 141,602 |
| HMO | 1,157,268,814 | 473,777 | 52,214 |
| CTHP | 117,297 | 1,565 | 426 |
| DME and Hearing Aid | 79,573,826 | 1,972,736 | 137,553 |
| Child Care | 823 | 31 | 1 |
| Family Health Plus | 2,121,017 | 9,260 | 1,619 |
| Referred Ambulatory | 6,443,631 | 234,497 | 47,871 |
| ICF-DD | 95,230,212 | 216,300 | 631 |
| Hospice | 56,148,776 | 16,248 | 2,252 |
| Community/Rehab Services | 685,407,638 | 967,638 | 5,730 |
| Case Management | 24,902,961 | 80,978 | 6,665 |
*Dually eligible as of December 2010
**ER is a subset of COS08-Clinic
Note: Medicaid expenditures by SURS category of service do not add up to "Total Expenditures", since some infrequently used Categories of Service are not shown, i.e., Therapists, Nurse Practitioners, and Clinical Social Workers
Top 5 Medicaid Services 2010 (65 plus)
- By Recipients:
- Physicians
- Hospital Based Clinics
- Transportation
- DME/Hearing Aids
- By Expenditure:
- SNF $4.4B
- Home and Community Based $3.2B
- MLTCP $1.2B
- Community/Rehab Services $685M
- Inpatient $285M
Represents co-pays and deductibles paid by Medicaid for Duals.
Conclusion
- Work in progress
- Opportunities and Challenges
- CMS letter to State Medicaid Directors (7/8/11) on Financial Models to Support State Efforts to Integrate Care for Medicare-Medicaid Enrollees
- About real people not numbers
Questions?
Mark Kissinger mlk15@health.state.ny.us
MLTC Work Group MLTCWorkGroup@health.state.ny.us
MLTC Application Questions mltcapps@health.state.ny.us
