Youth Tobacco Surveillance New York State 2006
Executive Summary
Cigarette use is the leading preventable cause of death in the United States. Youth are vulnerable to becoming smokers and the majority of people who become regular cigarette smokers begin during adolescence. In New York State, approximately 168,000 youth out of 1.6 million report having smoked in the past 30 days.
The New York State Department of Health's Tobacco Control Program has set a goal of reducing by 100,000 the number of youth who smoke by the year 2010. The program aims to reduce environmental supports for smoking through implementation of tobacco-free policies, changing social norms that support tobacco use and reducing public acceptance of tobacco use. Program strategies include paid media campaigns designed to increase cessation, reduce nonsmokers exposure to secondhand smoke, and expose industry tactics regarding marketing; mobilization of communities to de-normalize tobacco use; promotion of evidenced based cessation practices among health care providers and their organizations; and direct assistance with quitting provided by the New York State Smokers' Quitline.
This report provides current tobacco use estimates for students in New York State, and for students in New York City and the Rest of State, in grades 6-12 in 2006 including comparison data from prior surveys. The main findings of this report are:
- Among high school students in New York State in 2006, 16.3% smoked cigarettes on 1 or more of the past 30 days (current use). This rate approaches the Healthy People 2010 national health objective goal of 16%.
- The 2006 prevalence rate for any tobacco use by high school students during the preceding month (21.8%) approaches the Healthy People 2010 national health objective of 21%.
- There was a significant decline in the rate of current smoking among both middle and high school students in New York State from 2000 to 2006 but not from 2004 to 2006.
- The prevalence of smokeless tobacco use in the state remains essentially unchanged since 2000. The 2006 prevalence for smokeless tobacco use was 1.7% for middle school students and 3.2% for high school students.
- Non-Hispanic white high school students smoked at a higher rate (20.1%) than non-Hispanic blacks (7.9%) or Hispanics (13.4%) in the state.
Introduction
This report presents results from the New York State Youth Tobacco Survey (NYS YTS) conducted in 2006 and in previous even-numbered years since 2000. Estimates presented in this report include current cigarette use among students in middle school (Grades 6 to 8) and high school (Grades 9 to 12) including rates by gender, race/ethnicity, grade and the geographic regions of New York City (NYC) and the Rest of the State (ROS). (New York City includes the 5 counties of Bronx, Kings, New York, Queens, and Richmond. The Rest of the State refers to the 57 counties of New York State exclusive of New York City.) Estimates for other tobacco products including cigars, smokeless tobacco, pipes, bidis, and kreteks are also provided.
Changes from 2004 to 2006 are highlighted in the text. Tables and figures show trends from 2000 to 2006 providing information on longer-term changes in youth tobacco use in New York State.
Methods
In 2006, 7,306 middle school and high school students in 72 schools in the state completed the survey. All students within selected classes were eligible to participate. Information on the number of schools and students for each survey year is provided in Table 1.
SAS and SUDAAN statistical analysis software were used to compute 95% confidence intervals and to conduct comparison tests while adjusting for stratification and clustering of the sample. Logistic regression was used to test for linear trends. All differences noted in the text are significant at p<0.05.
Definitions:
- Current Use
- having used tobacco on one or more of the past 30 days.
- Middle School
- students who report that they were in grades 6, 7, or 8.
- High School
- students who report that they were in grades 9, 10, 11, or 12.
- New York City
- includes the 5 counties of Bronx, Kings, New York, Queens, and Richmond.
- Rest of the State
- refers to the 57 counties of New York State exclusive of New York City.
- Bidis
- are small, brown, hand-rolled cigarettes from India and other Southeast Asian countries consisting of tobacco wrapped in a tendu or temburni leaf and tied at one end with a string.
- Kreteks
- are clove cigarettes made in Indonesia that contain clove extract and tobacco.
Findings
Cigarette Use
New York State
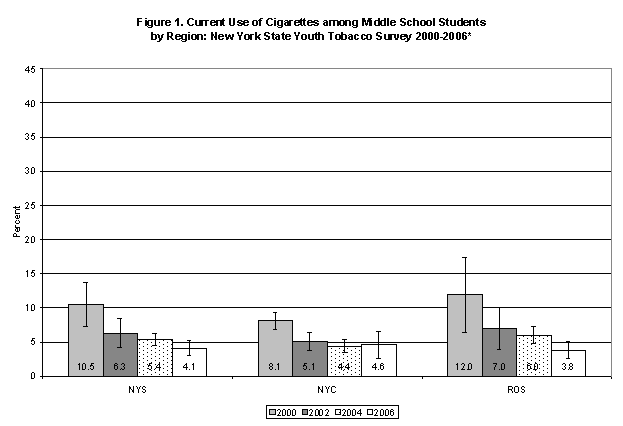
Current smoking among NYS middle school students in 2006 was 4.1%. This rate is not significantly different from the 2004 rate of 5.4 % (Tables 2 & 3). Smoking among middle school females (5.0%) was higher than males (3.2%). There were no significant differences among middle school students by race/ethnicity. The rate of smoking among 6th (2.3%) and 7th (2.7%) grade students was significantly lower than among 8th (6.7%) grade students. Trends in cigarette use from 2000 to 2006 for middle school students are shown in Figure 1.
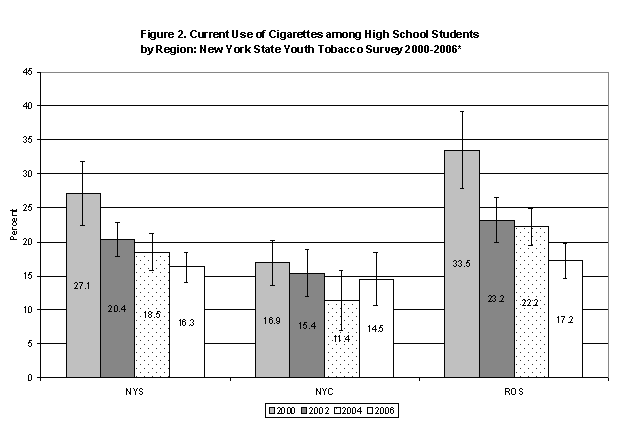
Current smoking among high school students was 16.3% in 2006 with no significant change from the rate of 18.5% in 2004. There was no difference in the rate of smoking by gender. High school smoking was highest among non-Hispanic whites (20.1%), followed by Hispanics (13.4%) and non-Hispanic blacks (7.9%). The rate of smoking among 9th grade students (12.7%) was significantly lower than among 11th grade students (18.4%). There were no other significant differences by grade level. Trends in cigarette use from 2000 to 2006 for high school students are shown in Figure 2.
New York City
In NYC, current smoking among middle school students was 4.6% in 2006 with no significant change from the rate of 4.4% in 2004. Females smoked at a higher rate (5.7%) than males (3.6%), and there was no difference in the rate of smoking by race/ethnicity for middle school students. The rate of smoking among 6th and 7th grade students (2.2% and 3.8%, respectively) was significantly lower than among 8th grade students (6.6%).
Current smoking among NYC high school students was 14.5% in 2006 with no significant change from 11.4% in 2004. There was no significant difference in smoking between males and females (15.5% and 13.3%, respectively). NYC high school non-Hispanic whites smoked at a higher rate (29.3%) than non-Hispanic blacks (6.8%) or Hispanics (11.7%). There was no significant difference in the rate of smoking by grade level for high school students in NYC.
Rest of the State/Outside of NYC
Current use of cigarettes among the ROS middle school students was 3.8% in 2006 with a significant decrease from the rate of 6.0% in 2004, (p<0.05). Females smoke at a higher rate (4.6%) than males (3.0%). The rate of smoking among Hispanic middle school students was higher than non-Hispanic whites (12.3%, 3.4%, respectively); no other differences were found.
The rate of smoking among 6th and 7th grade students (2.3% and 2.4%, respectively) was significantly lower than among 8th grade students (6.8%).
Smoking among high school students in the ROS was 17.2% in 2006 with a significant decrease from the rate of 22.2% in 2004, (p<0.05). The prevalence of smoking among males (16.1%) and females (18.3%) was not significantly different. Non-Hispanic whites smoke at a higher rate (18.8%) than non-Hispanic blacks (9.7%). The rate of smoking among Hispanics was 17.6%, similar to other groups. Ninth grade students smoked at a lower rate (11.6%) than 10th (17.9%) or 11th (21.7%) grade students. There were no other significant differences by grade level for the ROS high school students.
Current Use of Other Tobacco Products
Cigars
The prevalence of current cigar use was 2.8% among middle school students and 8.5% among high school students in NYS in 2006 (Table 4). In NYC, the rate of cigar use was 3.0% among middle school students and 4.7% among high school students. In the ROS, 2.7% of middle school students and 10.4% of high school students reported using cigars. None of these estimates were statistically different from the 2004 estimate (Table 5). Longer term (2000 to 2006) reductions in cigar use occurred among middle school and high school students statewide and among high school students in the ROS (Table 7).
Smokeless Tobacco
The prevalence of smokeless tobacco use was 1.7% among middle school students and 3.2% among high school students in NYS in 2006. In NYC, the rate of smokeless tobacco use was 1.5% among middle school students and 1.6% among high school students. For the ROS, 1.9% of middle school and 3.9% of high school students reported using smokeless tobacco. There were no significant differences between the 2006 and 2004 rates. Longer term (2000 to 2006) reductions in smokeless tobacco use occurred among high school students in the ROS (Table 8).
Pipes, Bidis, and Kreteks
Small percentages of NYS middle and high school students reported using pipes, bidis, and kreteks in the past 30 days. Current use among NYS middle school students was 1.3%, 1.6%, and 1.0% respectively and among high school students, 2.5%, 1.9%, and 2.1%, respectively. Significant declines from 2004 in use of pipes (2.6%) occurred among middle school students and for current use of bidis (2.9%), among high school students.
In NYC, use of pipes, bidis, and kreteks among middle school students was 1.3%, 1.8%, and 0.9% respectively and among high school students, 2.0%, 1.8%, and 1.5%, respectively. Pipe use among middle school students declined in 2006 compared to 2004 (3.8%).
In the ROS, use of pipes, bidis, and kreteks among middle school students was 1.3%, 1.6%, and 1.0% respectively, and among high school students, 2.8%, 1.9%, and 2.4%, respectively. Among high school students, current use of bidis declined in 2006 compared to 2004 (3.1%).
Current Use of Any Tobacco Product
Overall for New York State, 6.9% middle school students and 21.8% high school students reported using any tobacco product in the past 30 days in 2006 (Table 6). In NYC, 7.6% of middle school students and 17.7% of high school students report using any tobacco product. For NYC, there was a significant decrease among middle school student use of any tobacco product from 9.8% in 2004 to 7.6% in 2006, (p<0.05). For the ROS, 6.5% of middle school students and 23.7% of high school students report using any tobacco product in the past 30 days. For NYS and the ROS, no significant differences from 2004 were observed. Longer term (2000 to 2006) reductions in current use of any tobacco product occurred among middle school students statewide, in NYC and the ROS and among high school students statewide and in the ROS.
Summary of Findings
Cigarette use is the leading preventable cause of death in the United States (1). Youth are vulnerable to becoming smokers and the majority of people who become regular cigarette smokers begin during adolescence (2).
New York is close to achieving the Healthy People 2010 goals for youth smoking (1). The Healthy People 2010 goal for cigarette smoking among high school age youth is 16%, New York's rate is currently at 16.3%. Similarly, New York is nearing the Healthy People 2010 goal for use of any tobacco product of 21%. New York is currently at 21.8%.
Between 2004 and 2006, there were significant declines in current use of cigarettes among middle school and high school students in the ROS. No such changes were observed for NYS or NYC during this time period.
Overall, from 2000 to 2006, there were significant declines in cigarette smoking for middle school students in NYC, the ROS, and the state as a whole. For high school students, significant declines were noted for the ROS and NYS, but not in NYC.
Cigars remain the second most commonly used tobacco product. Between 2004 and 2006, there were no significant changes in cigar use for NYS, NYC or the ROS for either middle or high school students. The same result was observed for smokeless tobacco products.
Longer term (2000 to 2006) reductions in cigar use occurred among middle school and high school students statewide and among high school students in the ROS (Table 7). There were no changes among middle school or high school students in NYC during this time period. Decreased use of smokeless tobacco occurred only among the ROS high school students between 2000 and 2006.
References
1) U.S. Department of Health and Human Services. Healthy People 2010: Understanding and Improving Health. 2nd ed. Washington, DC: U.S. Government Printing Office, November 2000.
2) Task Force on Community Preventive Services. Recommendations regarding interventions to reduce tobacco use and exposure to environmental tobacco smoke. American Journal of Preventive Medicine 2001; 20 (suppl 2):10--5.
| Year | Number of Schools Contacted |
Number of Schools Participated |
Percent Schools Participated |
Number of Students Selected |
Number of Students Participated |
Percent Students Who Participated |
Overall Response Rate |
|---|---|---|---|---|---|---|---|
| 2000 | 91 | 77 | 84.6 | 9,740 | 8,919 | 91.6 | 77.5 |
| 2002 | 91 | 78 | 85.7 | 9,066 | 8,124 | 89.6 | 76.8 |
| 2004 | 96 | 80 | 83.3 | 9,476 | 8,325 | 87.8 | 73.2 |
| 2006 | 86 | 72 | 84.0 | 8,259 | 7,306 | 88.5 | 74.3 |
| New York State | New York City | Rest of the State | ||||||||||
|---|---|---|---|---|---|---|---|---|---|---|---|---|
| n1 | N2 | % | C.I.3 | n1 | N2 | % | C.I.3 | n1 | N2 | % | C.I.3 | |
| Middle School | 2,696 | 29,207 | 4.1 | 3.0-5.2 | 1,445 | 11,569 | 4.6 | 2.6-6.7 | 1,251 | 17,638 | 3.8 | 2.5-5.1 |
| Gender | ||||||||||||
| Male | 1,183 | 11,319 | 3.2 a | 3.2-4.2 | 621 | 4,436 | 3.6 a | 1.7-5.5 | 562 | 6,883 | 3.0 | 1.7-4.3 |
| Female | 1,494 | 17,786 | 5.0 b | 3.7-6.2 | 811 | 7,031 | 5.7 b | 3.2-8.3 | 683 | 10,755 | 4.6 | 3.0-6.1 |
| Race/Ethnicity | ||||||||||||
| Non-Hispanic White | 837 | 15,190 | 3.7 | 2.5-4.9 | 248 | 3,045 | 5.6 | 2.0-9.2 | 589 | 12,144 | 3.4 | 2.0-4.8 |
| Non-Hispanic Black | 518 | 4,617 | 4.3 | 1.6-7.0 | 306 | 3,097 | 4.8 | 1.9-7.7 | 212 | 1,520 | 3.5 | 0.0-8.6 |
| Hispanic | 994 | 7,537 | 6.6 | 3.3-9.9 | 649 | 3,634 | 4.4 | 1.9-7.0 | 345 | 3,903 | 12.3 | 3.5-21.2 |
| Non-Hispanic Other 4 | 224 | 1,368 | 2.8 | 0.0-6.8 | 171 | 1,368 | 4.0 | 0.0-9.4 | 53 | 0 | 0 | 0 |
| Grade | ||||||||||||
| 6 | 774 | 3,791 | 2.3 a | 0.8-3.8 | 384 | 1,493 | 2.2 a | 0.0-4.7 | 390 | 2,298 | 2.3 a | 0.3-4.2 |
| 7 | 866 | 7,748 | 2.7 a | 1.5-3.9 | 384 | 2,707 | 3.8 a | 1.2-6.5 | 482 | 5,040 | 2.4 a | 0.8-3.9 |
| 8 | 1,056 | 17,669 | 6.7 b | 4.4-8.9 | 677 | 7,369 | 6.6 b | 3.6-9.6 | 379 | 10,300 | 6.8 b | 3.4-10.1 |
| High School | 4,143 | 138,224 | 16.3 | 14.1-18.6 | 2,043 | 40,748 | 14.5 | 10.6-18.4 | 2,100 | 97,477 | 17.2 | 14.6-19.9 |
| Gender | ||||||||||||
| Male | 1,973 | 68,786 | 15.9 | 12.9-18.8 | 970 | 23,086 | 15.5 | 10.5-20.5 | 1,003 | 45,700 | 16.1 | 12.3-19.9 |
| Female | 2,143 | 68,508 | 16.8 | 13.7-19.8 | 1,055 | 17,122 | 13.3 | 8.3-18.3 | 1,088 | 51,386 | 18.3 | 14.5-22.2 |
| Race/Ethnicity | ||||||||||||
| Non-Hispanic White | 1,526 | 104,703 | 20.1 a | 17.4-22.8 | 371 | 19,681 | 29.3 a | 24.0-34.6 | 1,155 | 85,022 | 18.8 a | 15.8-21.7 |
| Non-Hispanic Black | 1,002 | 10,816 | 7.9 b | 4.5-11.3 | 567 | 5,732 | 6.8 b | 2.7-10.8 | 435 | 5,084 | 9.7 b | 3.4-16.0 |
| Hispanic | 1,117 | 1,5871 | 13.4 b | 9.3-17.4 | 753 | 10,027 | 11.7 b | 7.3-16.1 | 364 | 5,844 | 17.6 ab | 9.9-25.4 |
| Non-Hispanic Other 4 | 402 | 4,553 | 8.9 | 6.6-11.2 | 291 | 3,027 | 8.9 | 6.4-11.5 | 111 | 1,527 | 8.8 | 3.8-13.8 |
| Grade | ||||||||||||
| 9 | 906 | 28,108 | 12.7 a | 8.6-16.8 | 436 | 9,100 | 16.0 | 5.6-26.4 | 470 | 19,008 | 11.6 a | 7.4-15.7 |
| 10 | 1,222 | 37,668 | 16.6 a b | 13.2-19.9 | 522 | 8,734 | 13.4 | 7.7-19.2 | 700 | 28,934 | 17.9 b | 13.6-22.1 |
| 11 | 1,087 | 39,373 | 18.4 b | 14.7-22.2 | 566 | 10,214 | 12.9 | 6.9-18.9 | 521 | 29,159 | 21.7 b c | 17.7-25.8 |
| 12 | 928 | 33,075 | 17.8 a b | 12.9-22.7 | 519 | 12,699 | 15.9 | 10.0-21.8 | 409 | 20,376 | 19.2 a b c | 11.6-26.7 |
1Total sample size reporting cigarette use
2Weighted population estimate
395% Confidence Interval
4Non-Hispanic Other race category not included in tests of significant difference.
Note: Tests of significance are within region. Estimates with different superscripts are significantly different, p<0.05.
| 2000 | 2002 | 2004 | 2006 | Trend2 | 2000-2006 | ||||
|---|---|---|---|---|---|---|---|---|---|
| % | C.I.1 | % | C.I.1 | % | C.I.1 | % | C.I.1 | p-value | |
| Middle School | |||||||||
| New York State | 10.5 | 7.3-13.7 | 6.3 | 4.2-8.4 | 5.4 | 4.5-6.3 | 4.1 | 3.0-5.2 | p<0.01 |
| New York City | 8.1 | 6.9-9.3 | 5.1 | 3.7-6.4 | 4.4 | 3.3-5.5 | 4.6 | 2.6-6.7 | p<0.01 |
| Rest of the State | 12.0 | 6.5-17.5 | 7.0 | 3.9-10.1 | 6.0 | 4.7-7.2 | 3.8 | 2.5-5.1 | p<0.01 |
| High School | |||||||||
| New York State | 27.1 | 22.2-32.0 | 20.4 | 17.8-23.1 | 18.5 | 15.8-21.2 | 16.3 | 14.1-18.6 | p<0.01 |
| New York City | 16.9 | 13.5-20.3 | 15.4 | 11.6-19.2 | 11.4 | 7.1-15.8 | 14.5 | 10.6-18.4 | ns |
| Rest of the State | 33.5 | 27.6-39.4 | 23.2 | 19.7-26.8 | 22.2 | 19.5-24.9 | 17.2 | 14.6-19.4 | p<0.01 |
195% Confidence Interval
2Based on linear regression analysis
Note: ns = not significant
| New York State | New York City | Rest of the State | ||||||||||
|---|---|---|---|---|---|---|---|---|---|---|---|---|
| n1 | N2 | % | C.I.3 | n1 | N2 | % | C.I.3 | n1 | N2 | % | C.I.3 | |
| Middle School | ||||||||||||
| Cigarette | 2,696 | 29,207 | 4.1 | 3.0-5.2 | 1,445 | 11,569 | 4.6 | 2.6 – 6.7 | 1,251 | 17,638 | 3.84 | 2.4 – 5.1 |
| Cigar | 2,741 | 20,306 | 2.8 | 1.8-3.8 | 1,451 | 7,558 | 3.0 | 1.3 – 4.7 | 1,290 | 12,748 | 2.7 | 1.4 – 4.0 |
| Smokeless Tobacco | 2,739 | 12,635 | 1.7 | 0.8-2.6 | 1,448 | 3,677 | 1.5 | 0.3 – 2.6 | 1,291 | 8,957 | 1.9 | 0.6 – 3.1 |
| Pipe | 2,733 | 9,356 | 1.34 | 0.6-2.0 | 1,448 | 3,315 | 1.34 | 0.3 – 2.4 | 1,285 | 6,041 | 1.3 | 0.3 – 2.2 |
| Bidi | 2,725 | 11,927 | 1.6 | 0.9-2.4 | 1,439 | 4,418 | 1.8 | 0.6 – 2.9 | 1,286 | 7,509 | 1.6 | 0.6 – 2.6 |
| Kretek | 2,736 | 6,927 | 1.0 | 0.5-1.4 | 1,457 | 2,280 | 0.9 | 0.3 – 1.5 | 1,279 | 4,647 | 1.0 | 0.3 – 1.7 |
| Any Tobacco Product | 2,588 | 47,648 | 6.9 | 5.2-8.5 | 1,360 | 17,896 | 7.6 | 4.7-10.5 | 1,228 | 29,752 | 6.5 | 4.3-8.6 |
| High School | ||||||||||||
| Cigarette | 4,143 | 138,224 | 16.3 | 14.1-18.6 | 2,043 | 40,748 | 14.5 | 10.5– 18.5 | 2,100 | 97,477 | 17.24 | 14.4 – 20.0 |
| Cigar | 4,253 | 7,3621 | 8.5 | 6.8-10.2 | 2,083 | 13,307 | 4.7 | 2.9 – 6.5 | 2,170 | 60,314 | 10.4 | 8.2 – 12.6 |
| Smokeless Tobacco | 4,253 | 27,285 | 3.2 | 1.7-4.6 | 2,090 | 4,646 | 1.6 | 0.8 – 2.4 | 2,163 | 22,639 | 3.9 | 1.7 – 6.1 |
| Pipe | 4,262 | 21,673 | 2.5 | 1.6-3.3 | 2,088 | 5,658 | 2.0 | 1.1 – 2.8 | 2,174 | 16,015 | 2.8 | 1.5 – 4.0 |
| Bidi | 4,231 | 16,179 | 1.94 | 1.3-2.4 | 2,067 | 5,101 | 1.8 | 1.0 – 2.6 | 2,164 | 11,079 | 1.94 | 1.2 – 2.6 |
| Kretek | 4,242 | 18,202 | 2.1 | 1.4-2.8 | 2,073 | 4,274 | 1.5 | 0.7 – 2.3 | 2,169 | 13,927 | 2.4 | 1.4 – 3.4 |
| Any Tobacco Product | 4,088 | 182,858 | 21.8 | 18.8-24.8 | 1,982 | 48,012 | 17.7 | 13.1-22.3 | 2,106 | 134,846 | 23.7 | 19.9-27.5 |
1Total sample size reporting tobacco use
2Weighted population estimate
395% Confidence Interval
4Indicates significant reduction from corresponding 2004 estimate, p<0.05
| New York State | New York City | Rest of the State | ||||||||||
|---|---|---|---|---|---|---|---|---|---|---|---|---|
| n1 | N2 | % | C.I.3 | n1 | N2 | % | C.I.3 | n1 | N2 | % | C.I.3 | |
| Middle School | ||||||||||||
| Cigarette | 3,777 | 38,184 | 5.4 | 4.5-6.3 | 1,799 | 11,258 | 4.4 | 3.3-5.5 | 1,978 | 26,926 | 6.0 | 4.7-7.2 |
| Cigar | 3,722 | 24,897 | 3.6 | 2.9-4.2 | 1,731 | 11,321 | 4.7 | 3.8-5.6 | 1,991 | 13,576 | 3.0 | 2.2-3.7 |
| Smokeless Tobacco | 3,700 | 17,560 | 2.5 | 2.0-3.1 | 1,716 | 7,784 | 3.3 | 2.6-4.3 | 1,984 | 9,776 | 2.1 | 1.5-2.8 |
| Pipe | 3,720 | 18,297 | 2.6 | 1.7-3.5 | 1,730 | 9,103 | 3.8 | 1.8-5.7 | 1,990 | 9,193 | 2.0 | 1.3-2.7 |
| Bidi | 3,696 | 13,258 | 1.9 | 1.2-2.6 | 1,708 | 5,061 | 2.1 | 1.1-3.2 | 1,988 | 8,197 | 1.8 | 1.0-2.6 |
| Kretek | 3,697 | 9,954 | 1.4 | 0.9-2.0 | 1,725 | 4,150 | 1.7 | 0.9-2.6 | 1,972 | 5,804 | 1.3 | 0.6-1.9 |
| Any Tobacco Product | 3,568 | 58,900 | 8.8 | 7.6-10.0 | 1,642 | 22,372 | 9.8 | 8.3-11.4 | 1,926 | 36,528 | 8.2 | 6.6-9.4 |
| High School | ||||||||||||
| Cigarette | 4,103 | 149,199 | 18.5 | 15.8-21.2 | 1,660 | 31,515 | 11.4 | 7.1-15.8 | 2,443 | 117,684 | 22.2 | 19.5-24.9 |
| Cigar | 4,093 | 66,508 | 8.3 | 6.8-9.7 | 1,623 | 12,856 | 4.8 | 2.4-7.1 | 2,470 | 53,652 | 10.0 | 8.6-11.4 |
| Smokeless Tobacco | 4,063 | 32,418 | 4.1 | 2.6-5.5 | 1,608 | 3,935 | 1.5 | 0.8-2.2 | 2,455 | 28,482 | 5.3 | 3.5-7.2 |
| Pipe | 4,100 | 31,439 | 3.9 | 2.6-5.2 | 1,622 | 10,782 | 4.0 | 0.8-7.3 | 2,478 | 20,657 | 3.8 | 2.6-5.1 |
| Bidi | 4,082 | 23,093 | 2.9 | 2.3-3.5 | 1,609 | 6,368 | 2.4 | 1.9-2.9 | 2,473 | 16,724 | 3.1 | 2.3-4.0 |
| Kretek | 4,079 | 16,867 | 2.1 | 1.5-2.7 | 1,618 | 3,860 | 1.4 | 0.4-2.5 | 2,461 | 13,008 | 2.4 | 1.8-3.1 |
| Any Tobacco Product | 4,003 | 190,547 | 24.2 | 21.5-26.8 | 1,563 | 44,229 | 17.1 | 12.6-21.6 | 2,440 | 146,318 | 27.6 | 25.3-30.0 |
1Total sample size reporting tobacco use
2Weighted population estimate
395% Confidence Interval
| 2000 | 2002 | 2004 | 2006 | Trend2 | 2000-2006 | ||||
|---|---|---|---|---|---|---|---|---|---|
| % | C.I.1 | % | C.I.1 | % | C.I.1 | % | C.I.1 | p-value | |
| Middle School | |||||||||
| New York State | 13.4 | 9.8 -17.0 | 11.0 | 8.1 – 13.9 | 8.8 | 7.6 – 10.0 | 6.9 | 5.3 – 8.4 | p<0.01 |
| New York City | 12.0 | 9.2 – 14.7 | 10.1 | 7.8 – 12.5 | 9.8 | 8.3 – 11.3 | 7.6 | 4.9 – 10.3 | p <0.05 |
| Rest of the State | 14.3 | 8.5 – 20.0 | 11.5 | 7.1 – 15.8 | 8.3 | 6.6 – 9.9 | 6.5 | 4.4 – 8.5 | p<0.01 |
| High School | |||||||||
| New York State | 33.6 | 27.7 – 39.5 | 26.2 | 23.6 – 28.8 | 24.2 | 21.6 – 26.8 | 21.8 | 18.8 – 24.8 | p<0.01 |
| New York City | 20.6 | 17.0 – 24.1 | 19.9 | 14.7 – 25.0 | 17.1 | 12.7 – 21.4 | 17.7 | 13.2 – 22.2 | ns |
| Rest of the State | 41.6 | 34.7 – 48.5 | 29.6 | 26.5 – 32.6 | 27.6 | 25.3 – 29.9 | 23.7 | 20.0 – 27.4 | p<0.01 |
195% Confidence Interval
2Based on linear regression analysis
Note: ns = Not significant
| 2000 | 2002 | 2004 | 2006 | Trend2 | 2000-2006 | ||||
|---|---|---|---|---|---|---|---|---|---|
| % | C.I.1 | % | C.I.1 | % | C.I.1 | % | C.I.1 | p-value | |
| Middle School | |||||||||
| New York State | 4.6 | 3.2-5.9 | 3.9 | 2.9-4.9 | 3.6 | 2.9-4.2 | 2.8 | 1.8-3.8 | p <0.05 |
| New York City | 5.0 | 3.3-6.8 | 4.1 | 2.2-6.0 | 4.7 | 3.8-5.9 | 3.0 | 1.3-4.7 | ns |
| Rest of the State | 4.3 | 2.5-6.1 | 3.8 | 2.7-4.8 | 3.0 | 2.3-3.7 | 2.7 | 1.5-3.9 | ns |
| High School | |||||||||
| New York State | 11.9 | 8.6-15.2 | 9.6 | 7.7-11.5 | 8.3 | 6.8-9.7 | 8.5 | 6.8-10.2 | p <0.05 |
| New York City | 5.6 | 3.5-7.7 | 5.5 | 4.4-6.6 | 4.8 | 2.5-7.0 | 4.7 | 2.9-6.4 | ns |
| Rest of the State | 15.9 | 12.0-19.8 | 11.8 | 9.5-14.2 | 10.0 | 8.7-11.3 | 10.4 | 8.3-12.4 | p <0.01 |
195% Confidence Interval
2Based on linear regression analysis
Note: ns = not significant
| 2000 | 2002 | 2004 | 2006 | Trend2 | 2000-2006 | ||||
|---|---|---|---|---|---|---|---|---|---|
| % | C.I.1 | % | C.I.1 | % | C.I.1 | % | C.I.1 | p-value | |
| Middle School | |||||||||
| New York State | 2.0 | 1.1-2.8 | 3.6 | 1.6-5.6 | 2.5 | 2.0-3.1 | 1.7 | 0.8-2.6 | ns |
| New York City | 1.3 | 0.6-2.0 | 2.0 | 0.9-3.1 | 3.3 | 2.3-4.2 | 1.5 | 0.3-2.6 | ns |
| Rest of the State | 2.4 | 1.1-3.7 | 4.5 | 1.6-7.3 | 2.1 | 1.5-2.8 | 1.9 | 0.7-3.0 | ns |
| High School | |||||||||
| New York State | 4.6 | 3.2-5.9 | 5.5 | 2.5-8.5 | 4.1 | 2.7-5.5 | 3.2 | 1.7-4.6 | ns |
| New York City | 1.6 | 0.8-2.4 | 2.4 | 1.3-3.5 | 1.5 | 0.8-2.1 | 1.6 | 0.9-2.4 | ns |
| Rest of the State | 6.4 | 4.6-8.3 | 7.2 | 3.0-11.5 | 5.3 | 3.6-7.1 | 3.9 | 1.9-6.0 | p <0.05 |
195% Confidence Interval
2Based on linear regression analysis
Note: ns = not significant
