Managed Care Organization (MCO)
Baseline Survey – Results
Presentation Providing an Overview of the Results from the MCO Baseline Survey
- Results are also available in Portable Document Format (PDF)
6/28/2016
MCO Baseline Survey
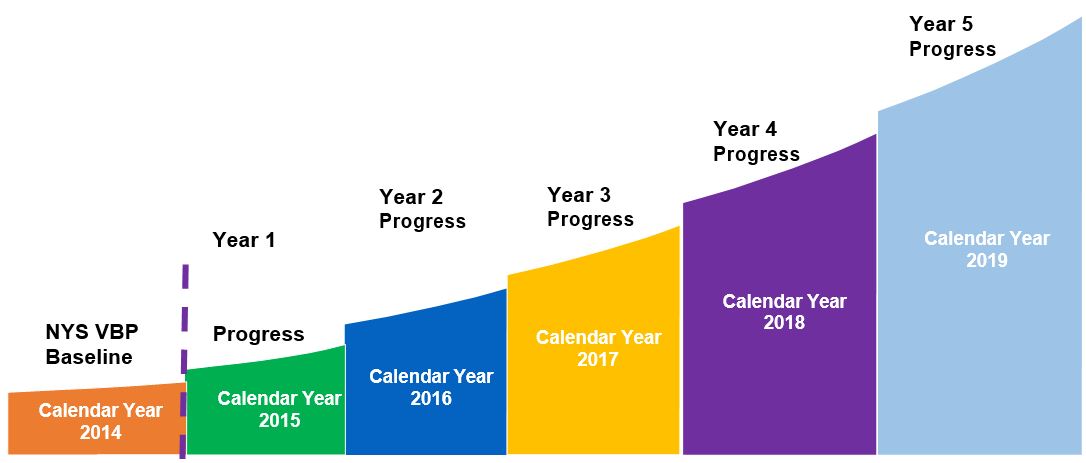
Starting Point for Statewide and Regional VBP Progress
CMS Reporting Requirements
The Baseline Survey was designed to meet the commitments of the VBP Roadmap for reporting progress to CMS on the Statewide Goal:
| Reference | Reported Information |
|---|---|
| NYS VBP Roadmap pg. 2 | VBP Progress measured in total dollars and outcomes |
| NYS VBP Roadmap pg. 2 | VBP Implementation guidelines, specifications, and changes to the Roadmap |
| NYS VBP Roadmap pg. 9 | Progress and details on the development of any ´off menu´ VBP arrangements |
| NYS VBP Roadmap pg. 21 | Details on how MCOs reward high or low performing providers, including expenditure trends per VBP arrangement |
| NYS VBP Roadmap pg. 31 | The annual percentage increase of VBP in the state, providers impacted by alternate payment arrangements, and percentage of provider payments impacted |
Purpose of the MCO Baseline Survey
- The purpose of this survey was to get a ´baseline´ for measuring statewide progress towards both the overall 80–90% VBP Goal and the 35% VBP Target for Levels 2 and 3
- 56 Health Plans Submitted Surveys, including:
- 16 Mainstream Managed Care
- 30 Managed Long Term Care
- 7 Medicaid Advantage Plus
- 3 HIV Special Needs Plans
MCO Baseline Survey Outline
The survey is broken down into the following eight sections:
- Section 1: Contact and Organization Information
- Section 2: Market Position
- Section 3: Management Contracts by Administrative Function
- Section 4: Medicaid Managed Care Spending by Category & Reimbursement Methods
- Section 5: Regional Spending
- Section 6: Use of Quality Metrics
- Section 7: Patient Incentives
- Section 8: Potentially Excluded Costs
Broad Overview of Results
VBP Baseline of Levels 1 – 3 for CY 2014: 25.5%
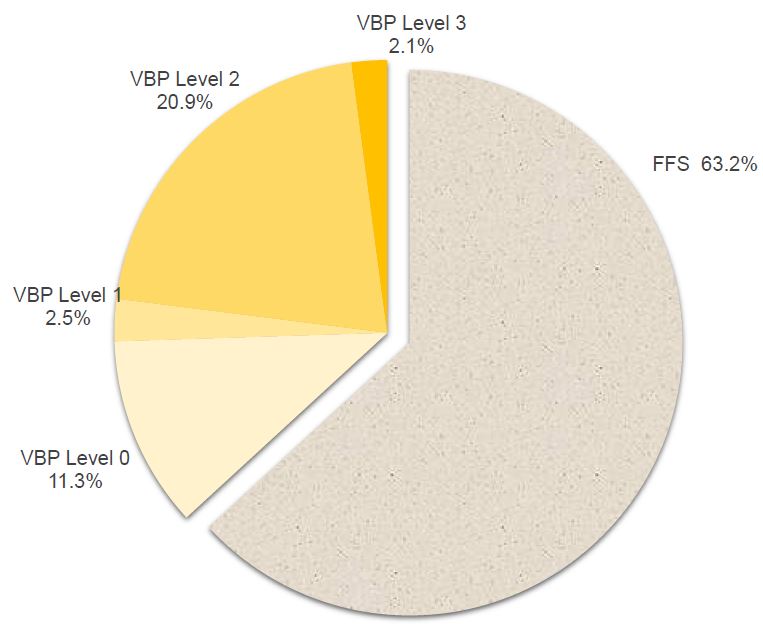
| VBP Level | Spending or % |
|---|---|
| Total Spending | $ 22,740,721,858 |
| FFS | $ 14,362,684,088 63.2% |
| VBP Level 0 | $ 2,575,676,354 11.3% |
| VBP Level 0 Quality | $ 2,036,359,972 9% |
| VBP Level 0 No Quality | $ 539,316,383 2.4% |
| VBP Level 1 | $ 567,583,615 2.5% |
| VBP Level 2 | $4,757,327,628 20.9% |
| VBP Level 3 | $477,450,172 2.1% |
*All unallocated plan spending is included under FFS
Results by Line of Business: Managed Long Term Care (MLTC) and Medicaid Managed Care (MMC)
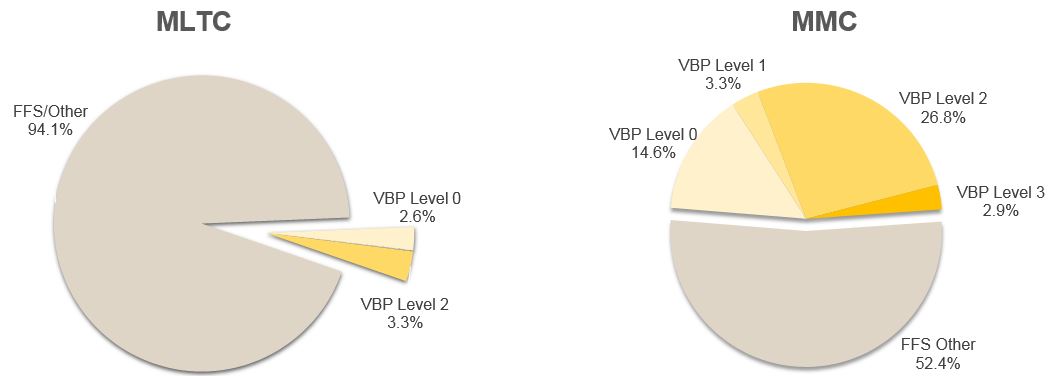
| Plan Type | Total | FFS/Other | VBP Level 0 | VBP Level 1 | VBP Level 2 | VBP Level 3 |
|---|---|---|---|---|---|---|
| MLTC | $ 5,114,452,482 | $ 4,813,251,661 | $ 132,294,419 | $ 1,749,399 | $ 167,157,003 | $ – |
| MMC | $ 16,595,927,084 | $ 8,698,195,942 | $ 2,429,094,296 | $ 549,827,893 | $ 4,441,358,780 | $ 477,450,172 |
*All unallocated plan spending is included under FFS
Results by Line of Business: Medicaid Advantage Plus (MAP) and HIV Special Needs Plans
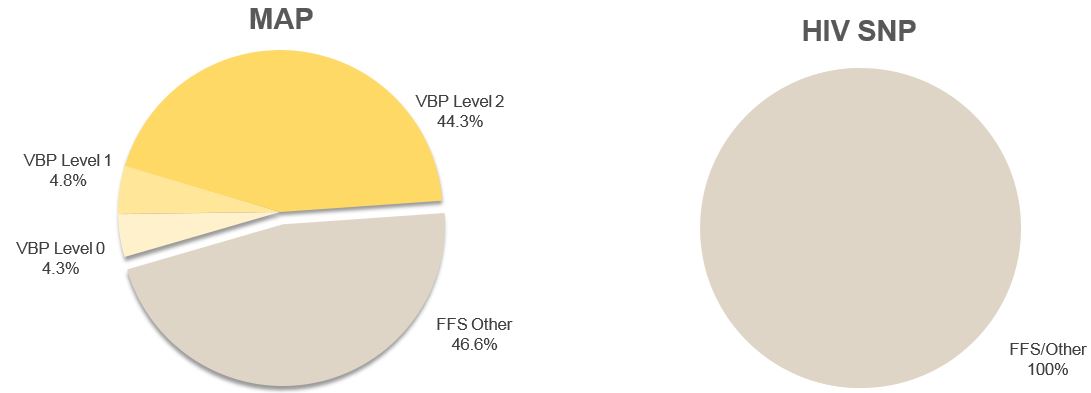
| Plan Type | Total | FFS/Other | VBP Level 0 | VBP Level 1 | VBP Level 2 | VBP Level 3 |
|---|---|---|---|---|---|---|
| MAP | $ 335,957,318 | $ 156,851,511 | $ 14,287,639 | $ 16,006,323 | $ 148,811,845 | $ – |
| HIV SNP | $ 694,384,974 | $ 694,384,974 | $ – | $ – | $ – | $ – |
*All unallocated plan spending is included under FFS
Comparison with the Catalyst for Payment Reform Survey (CPR)
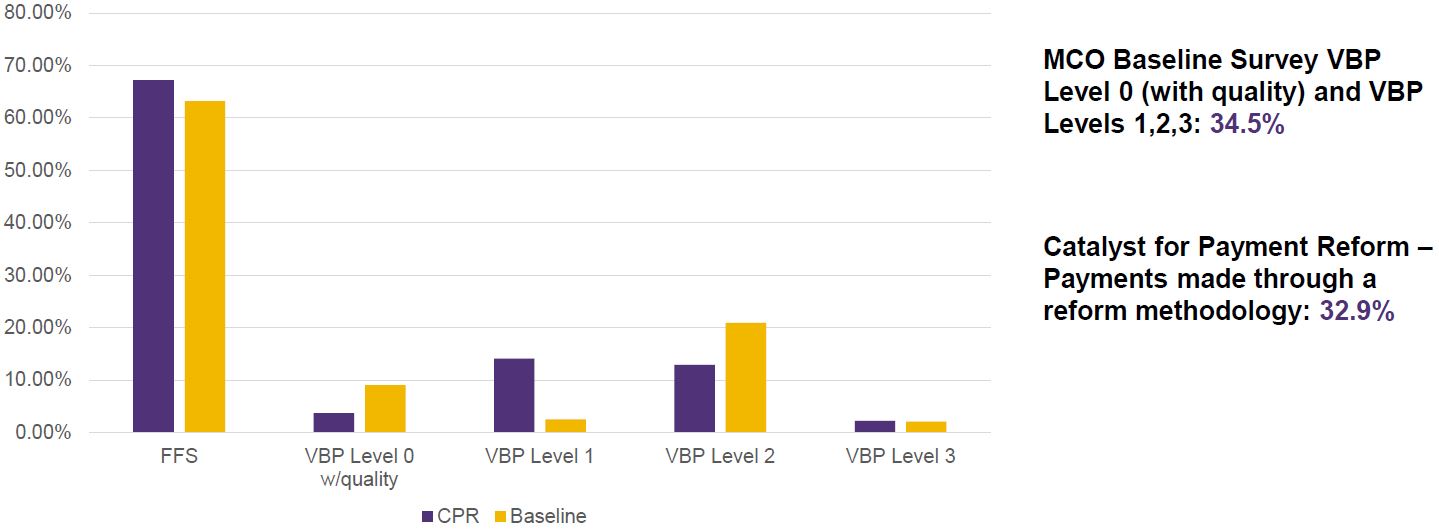
- CPR Survey involved 15 MMCs, while the Baseline Survey took information from 56 plans across MMC, MLTC, MAP, and HIV SNP.
- Baseline ties to MMCOR submissions for CY 2014, while CPR was for CY 2013.
Regional Breakout for Mainstream Managed Care Plans
| MMC Regional | Total Spending | FFS % | VBP Level 0 % | VBP Level 1 % | VBP Level 2 % | VBP Level 3 % |
|---|---|---|---|---|---|---|
| All Regions | $ 16,595,927,084 | 49.0% | 14.4% | 3.5% | 26.8% | 0.6% |
| Central | $ 1,893,793,991 | 77.9% | 21.9% | 0.0% | 0.0% | 0.2% |
| Finger Lakes | $ 490,881,601 | 81.9% | 17.8% | 0.0% | 0.0% | 0.3% |
| Long Island | $ 954,442,498 | 54.8% | 13.6% | 2.1% | 28.5% | 1.0% |
| Mid–Hudson | $ 568,675,021 | 68.4% | 23.1% | 6.8% | 1.1% | 0.6% |
| New York City | $ 9,002,119,262 | 36.7% | 10.9% | 5.7% | 46.2% | 0.5% |
| Northeast | $ 584,248,201 | 73.7% | 24.7% | 0.4% | 0.0% | 1.3% |
| Northern Metro | $ 730,895,887 | 71.9% | 23.5% | 1.7% | 1.0% | 1.9% |
| Utica– Adirondack | $ 388,274,491 | 60.5% | 38.3% | 0.0% | 0.0% | 1.1% |
| Western | $ 1,026,019,489 | 81.6% | 17.8% | 0.0% | 0.0% | 0.6% |
*Plans significantly underreported for the regional section of the survey. Variances between amounts reported here and in previous sections reflect these unallocated funds
Regional Breakout for All Other Lines of Business
| Other Regional | Total Spending | FFS % | VBP Level 0 % | VBP Level 1 % | VBP Level 2 % | VBP Level 3 % |
|---|---|---|---|---|---|---|
| All Regions | $ 6,144,794,774 | 88.9% | 2.6% | 0.3% | 5.1% | 0.0% |
| New York City | $ 5,811,585,780 | 91.7% | 2.6% | 0.3% | 5.4% | 0.0% |
| Long Island /Northern Metro | $ 98,591,520 | 100.0% | 0.0% | 0.0% | 0.0% | 0.0% |
| Rest of State | $ 41,215,726 | 79.1% | 20.9% | 0.0% | 0.0% | 0.0% |
- Includes an aggregate of the Managed Long Term Care Plans, Medicaid Advantage Plus Plans and HIV SNP that were surveyed
- Regions for those three lines of business were grouped into the regions listed above
*Health Plans significantly underreported for the regional section of the survey. Variances between amounts reported here and in previous sections reflect these unallocated funds
