County Heat and Health Profile Reports
New Yorkers are at risk of heat-related illness because summer temperatures are warming and our bodies are not used to long periods of extreme heat. County Heat and Health Profiles help identify populations and neighborhoods at highest risk. The reports describe county temperature trends, summarize heat-related health effects, identify areas with populations at highest vulnerability to heat, and list some available adaptation resources. The County Heat and Health Profiles can help communities prepare for and prevent heat-related illness.
How to Use County Heat and Health Profile Reports?
Local health departments, county emergency planning offices and local governments can use this information to support efforts towards mitigating the impacts of extreme heat. The county profiles provide a picture of temperature trends and future projections, heat-related health effects, population and environmental vulnerability to heat and availability of adaptation resources for each county, excluding New York City.
Exposure: Heat
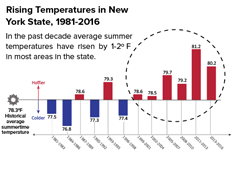
Overall, temperatures and heat events across the state are expected to rise throughout the century.
Each county report summarize summertime temperature trends from 1979-2016. Graphs display number of days with maximum temperature of 90ºF or more, increases over historical summertime average temperatures, and trends of monthly average temperatures from 1979 to 2016. Future temperature projections are also provided.
Sensitivity: Health
Exposure to high temperatures can cause heat-related illness and death and some people are more vulnerable.
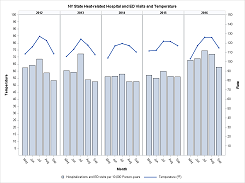
Each county report summarizes rates of hospitalization and emergency room visits for heat-related health outcomes along with monthly average temperatures. Higher rates of heat related illness, cardiovascular diseases and renal diseases are observed as monthly temperatures rise.
Vulnerability: Community
A community's demographic makeup and environmental characteristics influence how heat impacts health.
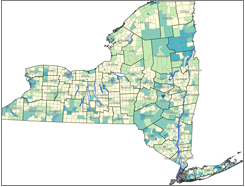
Each county reports groups heat vulnerability factors into four categories: language vulnerability, socio-economic vulnerability, environmental and urban vulnerability, and older adult isolation and vulnerability. Together they estimate the county's overall Heat Vulnerability Index. Identifying these community-level vulnerabilities to heat can help allocate adaptation resources more efficiently.
Adaptive Capacity: What to Do
Heat-related illness and deaths can be avoided by spending time in air conditioning.
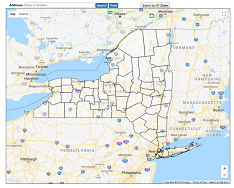
Each county report highlights the importance of spending a few hours in a cool or air-conditioned place to reduce the impact of heat on health. Learn more about New York State Cooling Assistance. In the absence of air-conditioning at home or work, cooling centers in the community are a valuable resource for cooling down during a heat wave. The profile contains links to information about places to get cool in each county.