NY State Heat Vulnerability Index Maps
Maps of the NY State Heat Vulnerability Index and the four categories of heat vulnerability are displayed below. Click the images below to view and download each map, or download all maps.
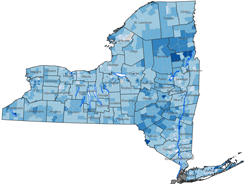
Heat Vulnerability Index
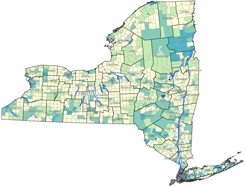
Overall the Heat Vulnerability Index for NY State showed that metropolitan and inner cities are most heat vulnerable. More than a third of NY State population resides in areas identified as moderately to highly vulnerable to heat. In addition to identifying overall heat vulnerability, it is important to recognize specific vulnerabilities among population subgroups and take appropriate actions to reduce heat effects
Language Vulnerability
Downstate areas showed higher language vulnerability than upstate NY, reflecting the higher proportion of immigrants in these regions. Among immigrants and others with limited understanding of English, language can be a barrier to accessing resources and understanding alert messages issued during emergencies. Heat awareness messages should be provided in commonly spoken languages of the specific area in order to best communicate the risks of heat.
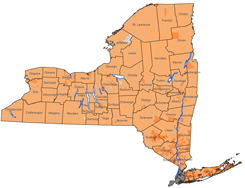
Socio-Economic Vulnerability
Socio-Economic Vulnerability Map
Vulnerability due to socio-economic status varied across the state with vulnerable tracts in rural and a few inner-city areas. Economic status of both an individual and their community can affect how one copes with extreme heat. While recommendations to use air conditioners during periods of extreme heat are commonly a part of cool-down messaging, this may not be an affordable option for low-income households. Community resources like cooling centers can help provide the public with a few hours of relief from hot weather. If public transportation is not available, getting to these facilities can be an obstacle for families and individuals who may not have their own vehicle.
Environmental/Urban Vulnerability
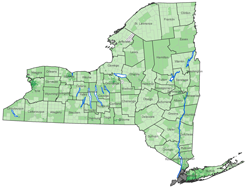
Environmental/Urban Vulnerability Map
Vulnerability in urban areas is associated with the built environment where temperatures in areas covered by sealed surfaces are often considerably warmer than surfaces covered in vegetation. This is called the Urban Heat island (UHI) effect and is observed because materials used in buildings, roads and pavements tend to retain heat. Programs to reduce heat should include developing parks, increasing green space, constructing green roofs, and using other materials that help cool rooftops and pavements.
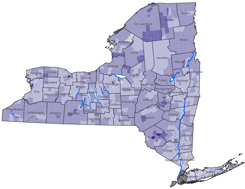
Elderly Vulnerability
Elderly Isolation/Elderly Vulnerability Map
Vulnerability among the elderly was mostly seen in rural areas of NY State where populations are often older than urban and suburban populations. Elderly people in rural areas may experience social isolation when they live away from family and the majority of the community. In addition, elderly in these areas will face the same challenges as other rural residents including fewer options for healthcare and thus less likely to receive timely assistance. For these reasons, efforts to reduce the health effects of heat should also target elderly in these areas.
